Getting data with Google Colab
Google Colab is an online platform where you can run written codes and check results easily.
Set up Google Colab environment
Get Google Colab data and upload to Google Drive
Google Colab requires a Google account and Google Drive for data access.
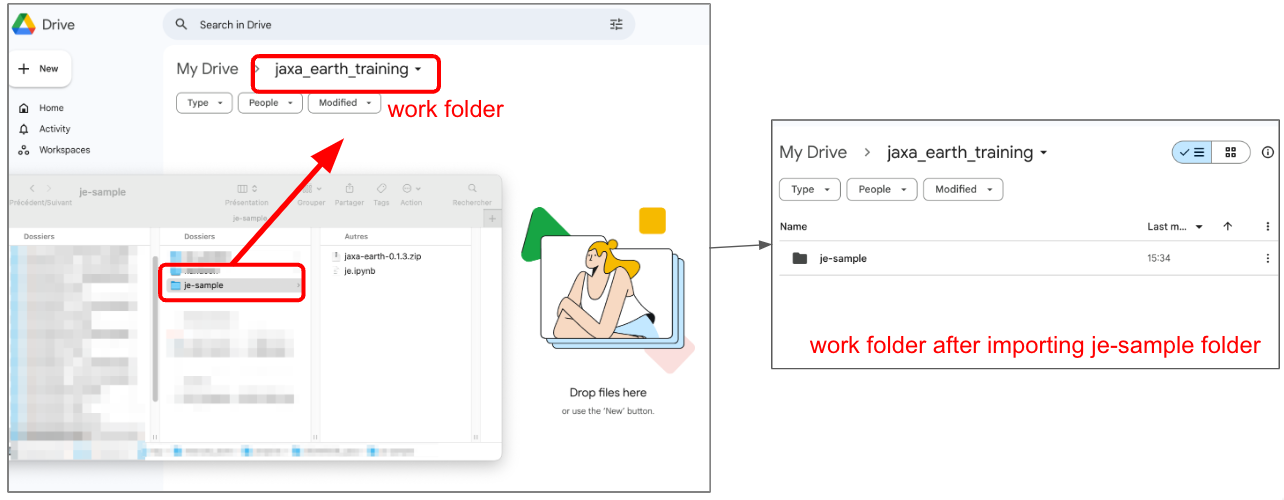
Download data below. You should have a je-sample directory in.
In Google Drive, create a work folder and drag and drop je-sample folder into it.
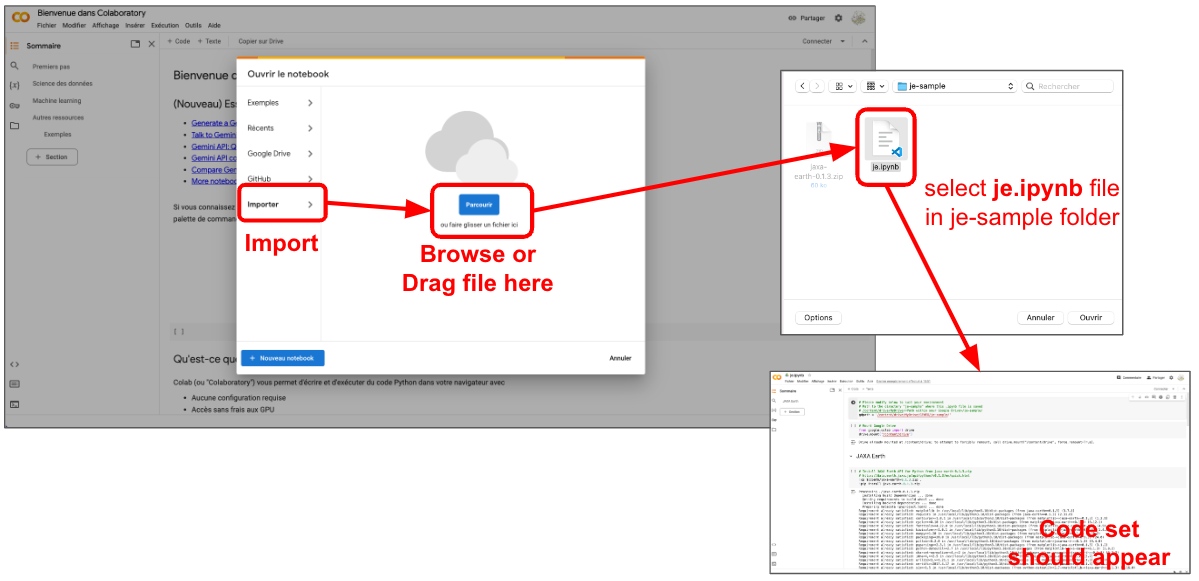
Code set is stored in the je.ipynb file. Let’s load it in Google Colab.
Go to Google Colab
Import the je.ipynb file as shown below, and the code set should be displayed.
Now, Google Drive environment needs to be mount.
Set launch envrionment in Google Colab
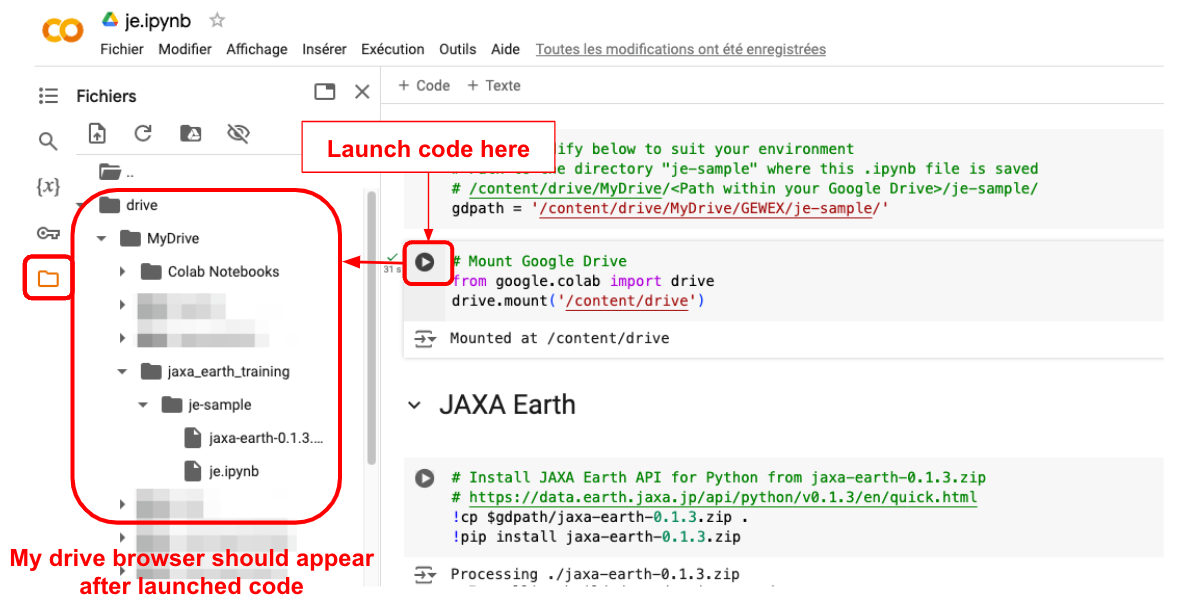
Launch Mount Google Drive code as below. A connection and access authorization to your Google account is required.
Once launched, browser panel should appears on the left side. You should retrieve je-sample folder which has been uploaded before.
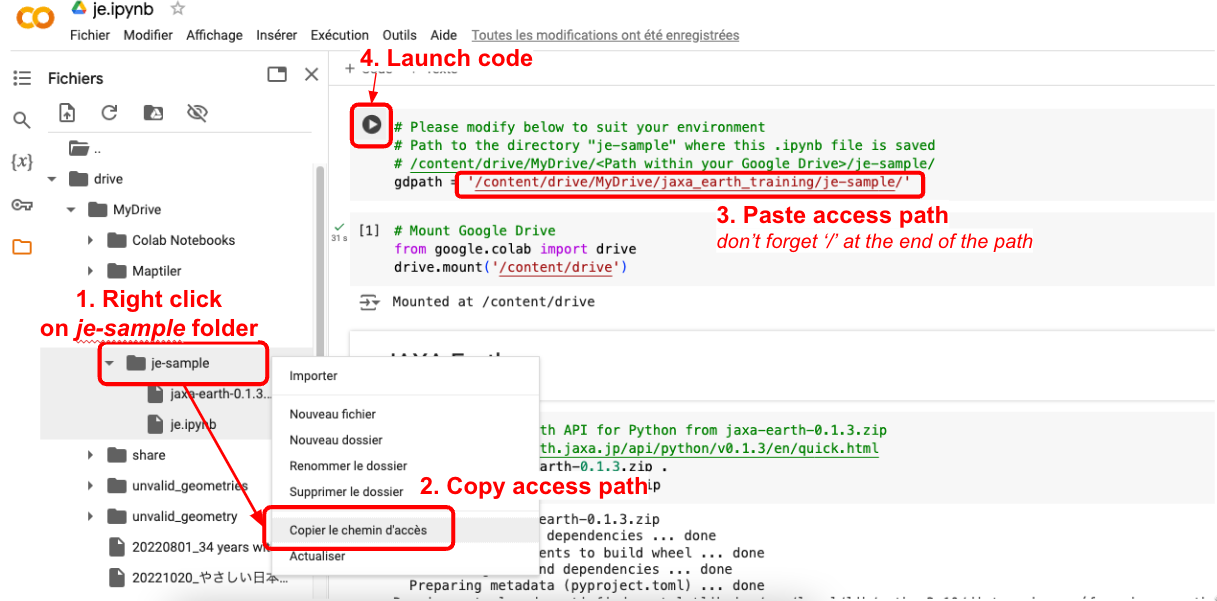
je-sample directory path has to be set to environment.
On browser panel, right click to je-sample folder and copy access path.
Paste this access path on gdpath variable and launch
Install JAXA Earth API for Python
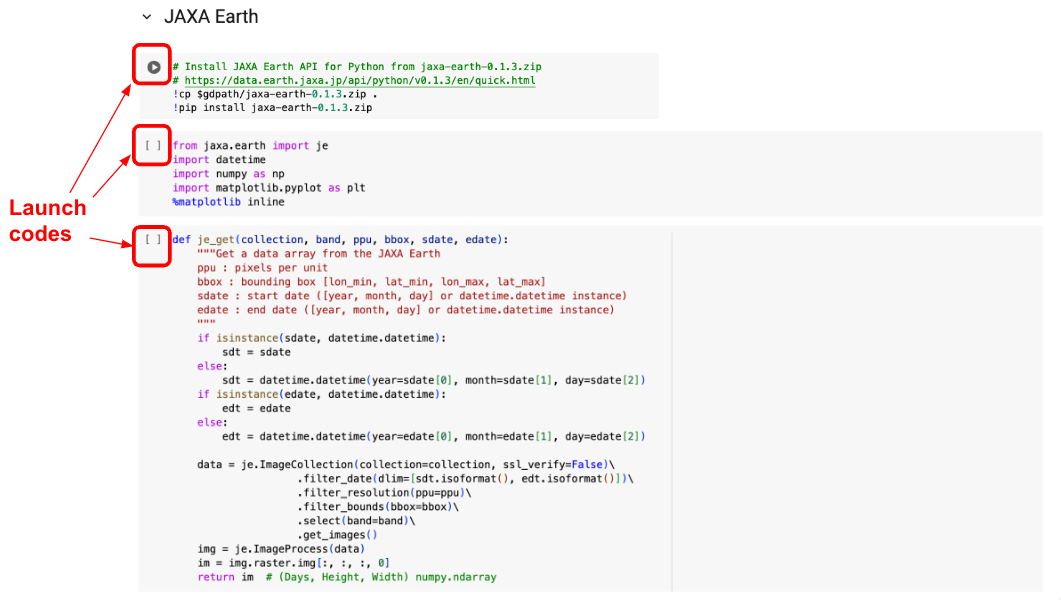
On je-sample folder, JAXA Earth Earth API for Python is stored in jaxa-earth-0.1.3.zip file.
- On Google Colab in JAXA Earth section, run the 3 first codes as below image.
First code install ZIP file
Second one import libraries including the just installed JAXA Earth library
Third one define a function to get data from JAXA Earth
Google Colab enviroment is ready to use.
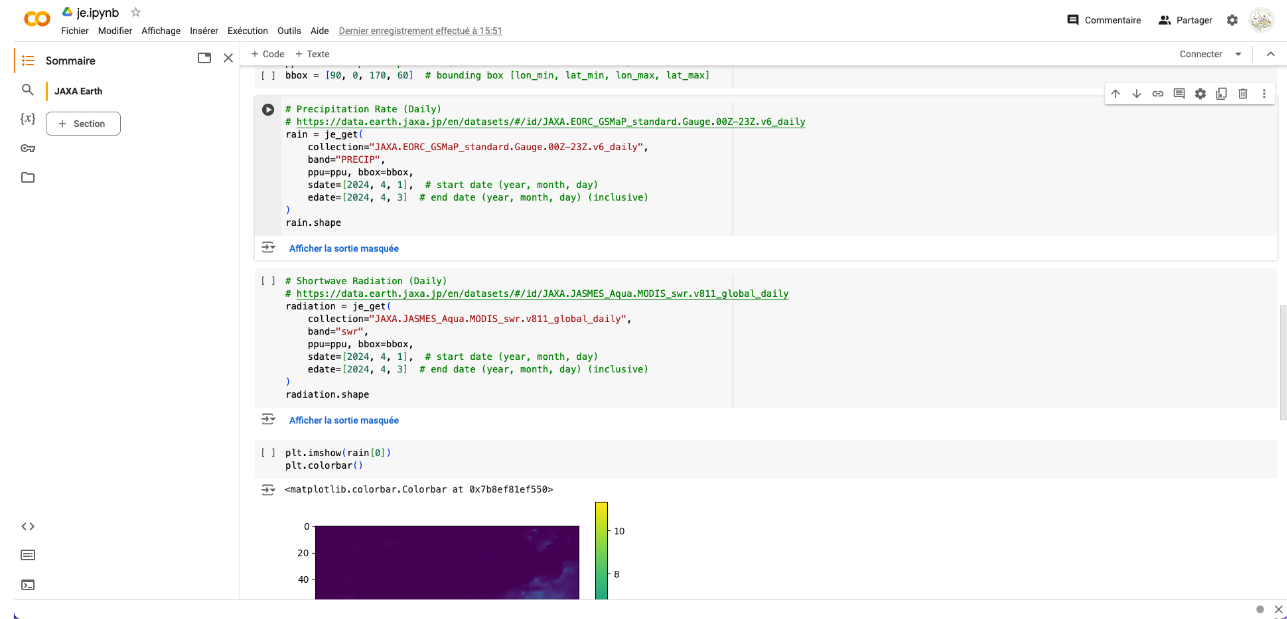
Get Precipitation rate (Daily)
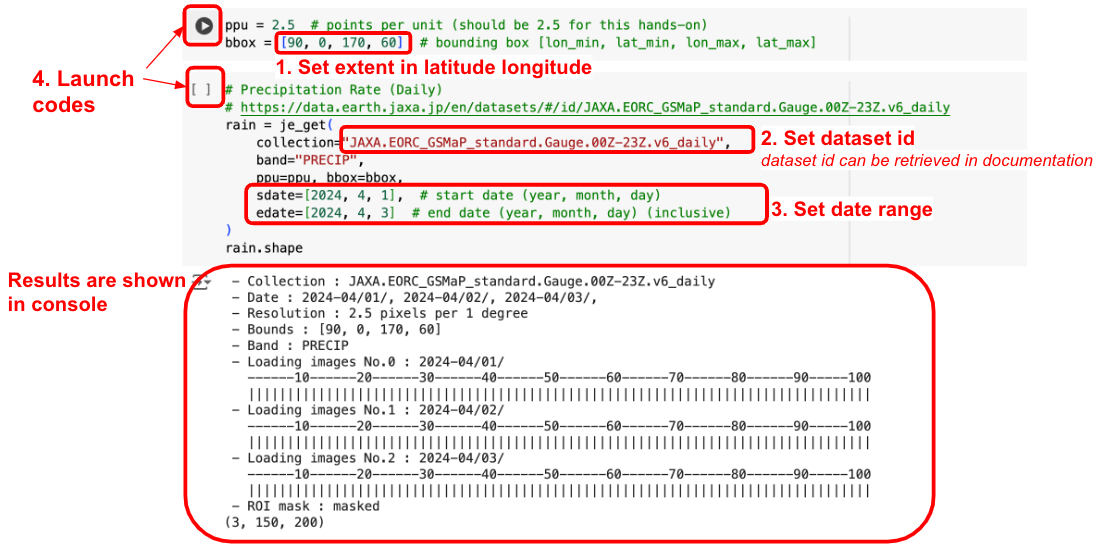
Data can be retrieved using the following parameters:
ppu: image resolution
bbox: area of interest
collection: target dataset
sdate: start date
edate: end date
For dataset details, refer to the documentation at https://data.earth.jaxa.jp/en/datasets/#/id/JAXA.EORC_GSMaP_standard.Gauge.00Z-23Z.v6_daily
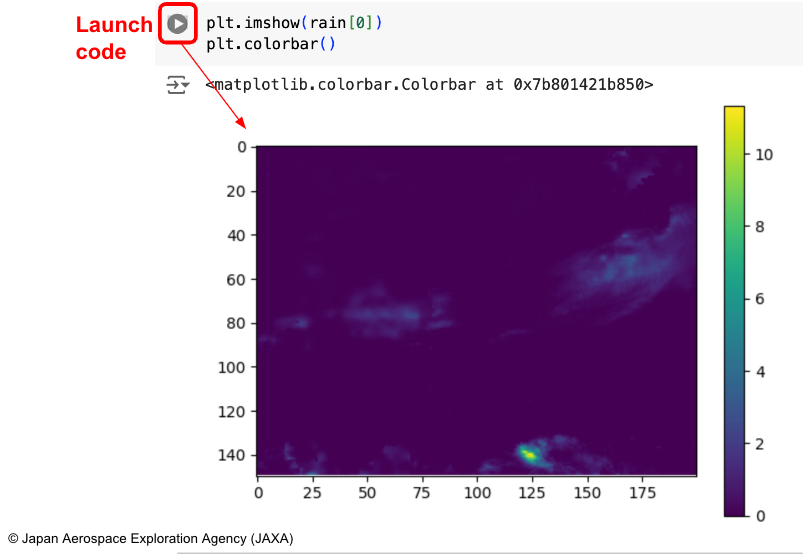
Run the codes as shown in the image below. Output data is stored as rain variable.
Run the next code to visualize dataset.
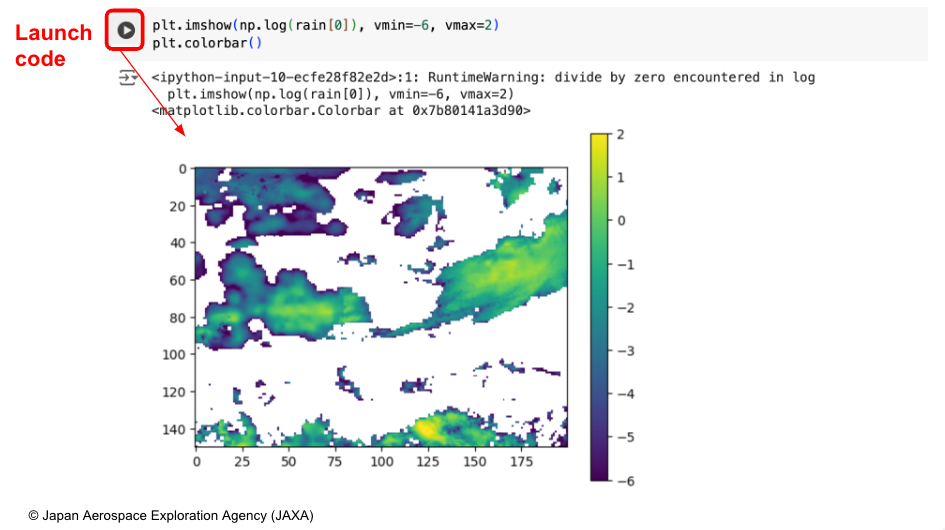
Since color range may be difficult to see, we can adjust the range values from -6 to 2 as example.
Run the next code to visualize filtered dataset.
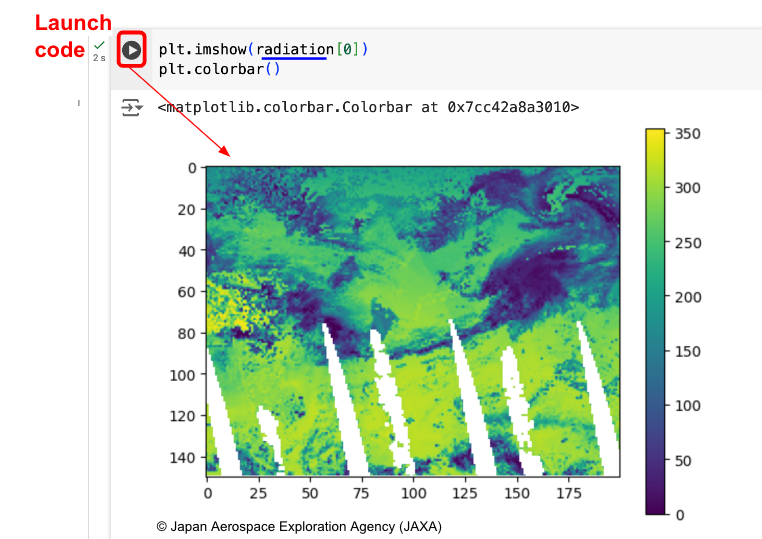
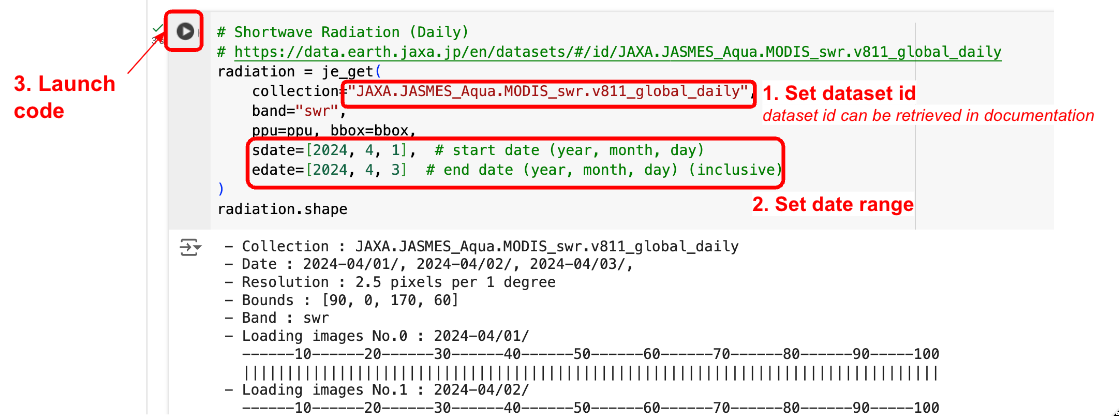
Get Shortwave Radiation (Daily)
Shortwave radiation can be retrieved with the same code, only the collection variable needs to be changed to the dataset ID. Dataset details can be checked in the documentation: https://data.earth.jaxa.jp/en/datasets/#/id/JAXA.JASMES_Aqua.MODIS_swr.v811_global_daily
Run the following code to get data as radiation variable.
Extent and resolution can be changed by editing ppu and bbox variables.
To visualize result, use the code previously used to visualize precipitation rate, replace rain variable with radiation, and run it.