JAXA Earth API for JavaScript
This is the API documentation for the JAXA Earth API in JavaScript. With this API, you can easily display satellite images in a browser and develop web applications that use satellite data.
For an overview of the JAXA Earth API, please refer here, and for various sample codes, please refer here.
Overview
The JAXA Earth API enables you to use various Earth observation satellite datasets. There are several types of datasets, including terrain, land surface temperature, and sea surface temperature. For more information on these datasets, please refer to this page.
The JAXA Earth API provides pre-calculated datasets of monthly statistical values and others. When the statistical periods differ, they are managed as separate datasets with different IDs.
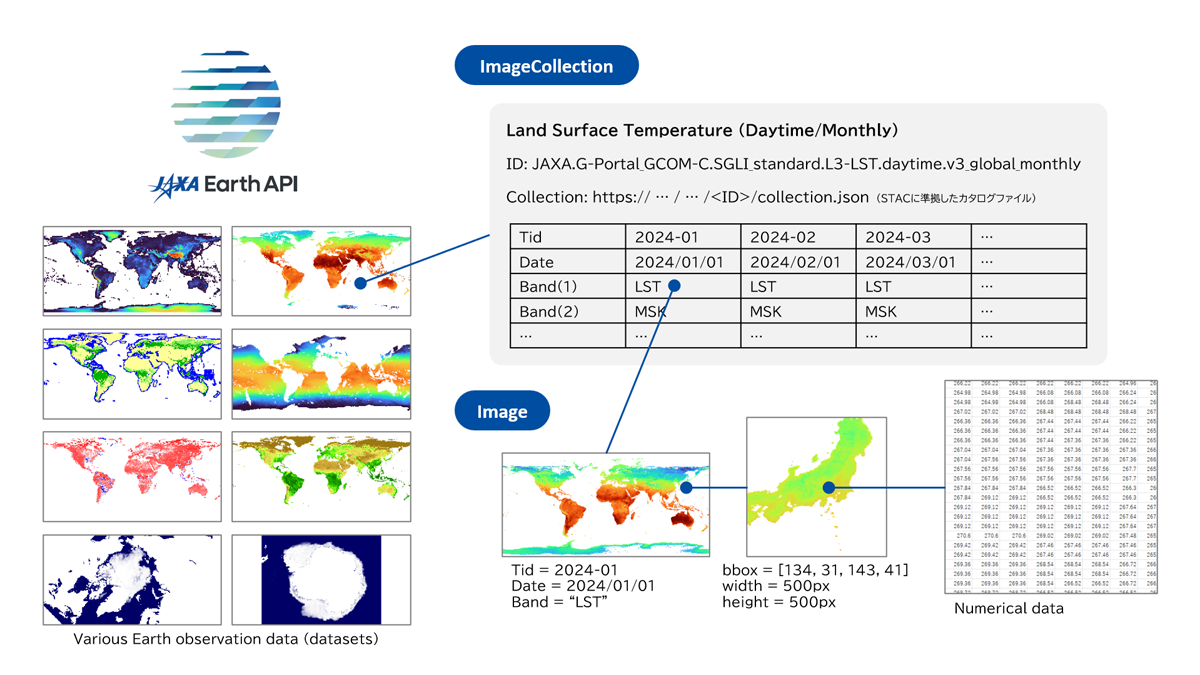
In the JAXA Earth API for JavaScript, each of these datasets is referred to as an ImageCollection object.
Within the ImageCollection object, multiple Image objects with different observation dates and times (Time ID (Tid)) are stored.
In some cases, data at each observation date and time may have multiple values, or "bands."
You can obtain an Image object from an ImageCollection object by specifying the observation date and band.
For the Image object, you can specify the latitude and longitude range from which to retrieve data, the output image size (in pixels), and the color map. This will provide the necessary data at the desired resolution.
Once the data has been loaded, it can be displayed in the browser as a canvas element (HTMLCanvasElement) or an image in DataURL format. You can also manipulate numerical arrays for statistical processing or switch color maps.
Because JAXA Earth API is designed to handle necessary data at the required resolution, it can handle data even when JavaScript is running in a browser.
Instructions for Use
The JAXA Earth API for JavaScript supports the ES Module (ESM) and Universal Module Definition (UMD) formats. Use whichever format is appropriate for your development method.
In the case of ESM format
Please download the module files from the following link.
https://data.earth.jaxa.jp/api/javascript/v1.2.3/jaxa.earth.esm.js
Create an HTML file as follows.
<!DOCTYPE html>
<html lang="ja">
<head>
	<meta charset="UTF-8">
	<title>esm</title>
</head>
<body>
	<script type="module"> //In the case of ESM format, it is mandatory to include type="module".

		//Load the module file.
		//It is assumed that both the HTML file and the jaxa.earth.esm.js file are located in the same folder.
		import * as je from "./jaxa.earth.esm.js";

		//All classes and methods are accessed using the je object.
		console.log(je);

		//Enter code here.

	</script>
</body>
</html>
Start the web server and access the HTML file. A web server is necessary for executing ESM-format JavaScript. Double-clicking the HTML file will not work. When running locally on your device, please use tools like VSCode's Live Server.
In the case of UMD format
Please download the module files from the following link.
https://data.earth.jaxa.jp/api/javascript/v1.2.3/jaxa.earth.umd.js
Create an HTML file as follows.
<!DOCTYPE html>
<html lang="ja">
<head>
	<meta charset="UTF-8">
	<title>umd</title>

	<!-- Loading the module file.-->
	<!-- It is assumed that both the HTML file and the jaxa.earth.umd.js file are located in the same folder.-->
	<script src="./jaxa.earth.umd.js"></script>
</head>
<body>
	<script>
		//All classes and methods are accessed using je as defined on the global object.
		console.log(je);

		//The UMD format does not support top-level await.
		//To simulate a top-level await, it is written within an asynchronous immediately-invoked function expression.
		(async function(){

			//Enter code here.

		})();
	</script>
</body>
</html>
Open this HTML file in a browser. You don't need a web server to run JavaScript in UMD format. You can also open it by double-clicking.
Code examples (common to both ESM and UMD formats)
The followings are examples of the code that should be written in the "// Enter code here." For more details on the available datasets, please refer to this page .
const image = await je.getImage({
	//Enter the URL of the collection.json for the dataset you are using.
	collection: "https://s3.ap-northeast-1.wasabisys.com/je-pds/cog/v1/JAXA.EORC_ALOS.PRISM_AW3D30.v3.2_global/collection.json",

	//Specify the bands of the dataset to be used.
	band: "DSM",

	//Enter the latitude and longitude range from which you would like to retrieve data.
	//[Minimum longitude (west), minimum latitude (south), maximum longitude (east), and maximum latitude (north)]
	bbox: [-180, -90, 180, 90],

	//Enter the size of the image to be acquired in pixels.
	width: 1000,
	height: 500,

	//Specify the colormap for visualization.
	colorMap: {
		//Minimum value
		min: 0,
		//Maximum value
		max: 6000,
		//Fill from the minimum to the maximum value using a jet color scale (rainbow colors ranging from blue to green to yellow to red).
		colors: "jet"
	}
});

//The visualized result is obtained as an HTMLCanvasElement and added to the HTML document.
document.body.appendChild(image.getCanvas());
Click here to see examples of execution results.
Other sample code
This page contains various sample codes.
About the time
In the JAXA Earth API, the time for each dataset is defined as Coordinated Universal Time (UTC). Date object of the JavaScript is typically created based on the device's local time. Therefore, when using the JAXA Earth API for JavaScript, time must always be specified in UTC. To specify the time in UTC, use Date.UTC().
It's also important to note that the JavaScript Date object requires months to be specified as values from 0 to 11.
// When specifying 2025/02/03 04:00:00 (UTC)
const date = new Date(Date.UTC(2025, 2 - 1, 3, 4, 0, 0));
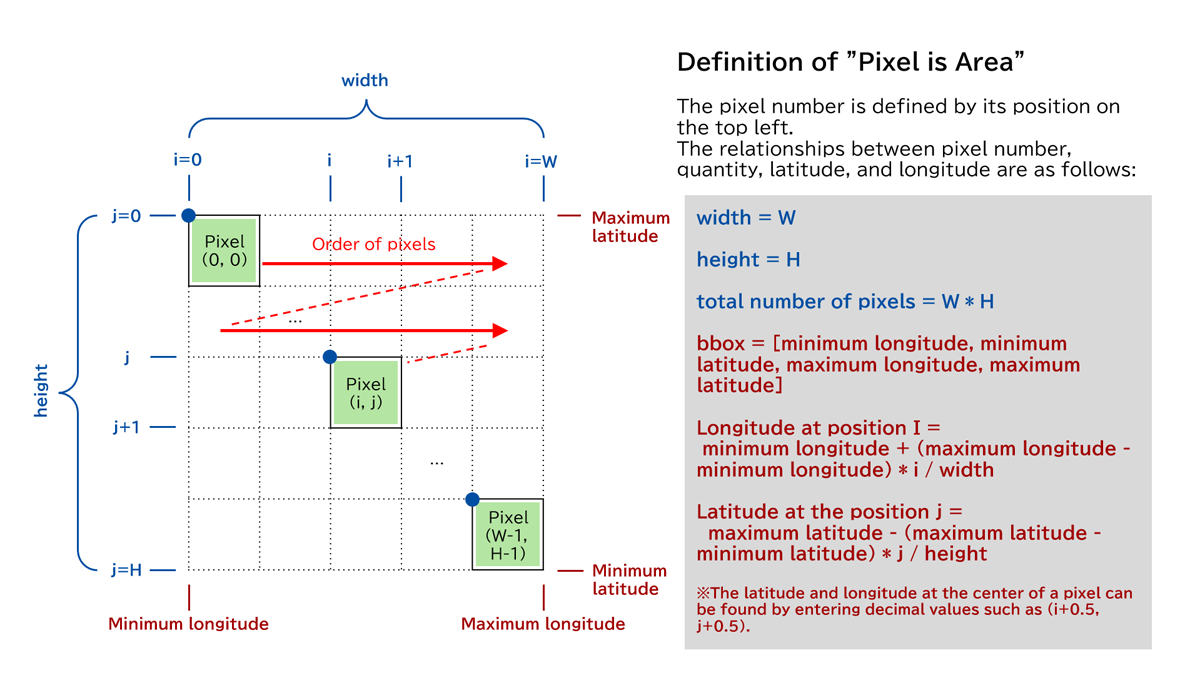
About pixels and latitude/longitude
The JAXA Earth API adopts the definition "Pixel is Area" for pixel positions. The pixel number is determined by the position of its top-left corner. Pixels are arranged sequentially in two directions: from the top left to the top right in the i direction, and from top to bottom in the j direction.
Furthermore, latitude and longitude use the equidistant latitude and longitude system (EPSG:4326), except for datasets of the North and South Poles. Therefore, the longitudes and latitudes in directions i and j are equally spaced.
Example of usage
The following is examples of how to use the JAXA Earth API in JavaScript.
Sea Level Rise Simulator (Domestic Version)
We simulate sea level rise using topographic data and the OpenLayers platform. The colors are instantly updated when the color map is switched according to the slider settings. This site is in Japanese only.
Sea Level Rise Simulator (Global Version)
We simulate sea level rise using topographic data and the OpenLayers platform. On the global version, the shaded relief map displayed in the background is also dynamically generated using JavaScript.
Sample code for Observable
By using Observable, you can interactively run the JAXA Earth API for JavaScript in the browser.
JAXA Earth Dashboard
This website, created using OpenLayers, allows you to view and utilize various data. It is currently under development using the JAXA Earth API for JavaScript. This site is in Japanese only.
Special Feature: Climate Change 2023
The latest observed sea surface temperature data around Japan is continuously displayed using the JAXA Earth API for JavaScript. This site is in Japanese only.
License
Certain data sets aside, the JAXA Earth API is available for commercial use. For more details, please check this page.
THIRD PARTY LICENSE(s):
Notice
- The current version uses browser-specific functions and functions dedicated to the browser's main thread. For this reason, it cannot be used with Node.js, Deno, Bun, or web workers. Support is planned for the next version.