Creating Practical Agent Skills
Using JAXA Earth API for JavaScript, you can also develop Agent Skills for integration with generative AI. This tutorial introduces generative AI integration through Agent Skills using Gemini CLI.
The content of this guide has been verified to work in the following environment (as of May 2026).
- Windows 11
- Node.js (v24.14.0)
- Gemini CLI (0.43.0)
Preparing the Skills
Download the complete set of Agent Skills files from the link below, extract the ZIP file, and save it to the folder described later.
Complete set of Agent Skills files (Japanese Version Only)
The source code includes the following files.
- jaxa-earth-api/
- SKILL.md //Configuration file for Agent Skills
- package.json //Node.js file describing information about this package
- scripts/ //Command-line tools run by the generative AI
- getImage.js //Function to save a PNG image
- getPixelGridCsv.js //Function to save a CSV file (in pixel order)
- getLngLatValuesCsv.js //Function to save a CSV file (longitude/latitude/value sets)
- getValue.js //Function to return the value of a single point
- getMonthlyTimeSeriesValues.js //Function to return monthly time-series data
- getDailyTimeSeriesValues.js //Function to return daily time-series data
- getLinks.js //Function to return related links
- jaxa.earth.esm.js //Module file of the JAXA Earth API
- jaxa.earth.esm.d.ts //Type definition file for the JAXA Earth API module
- references/ //API documentation and catalog files for the generative AI to reference
- docs.md //API documentation in Markdown format
- catalog.v2.md //Dataset catalog file in Markdown format
- assets/ //Reference sample code and related data used for analysis
- example/ //Various sample code
- geojson/ //GeoJSON files for masking by prefecture
In this way, functions that return values, images, and related information are bundled together with reference and documentation files.
SKILL.md clearly states what the generative AI should do and how. As shown below, even
tacit knowledge not written in the API documentation is described with explicit procedures and
reasoning. The following is a simplified English translation. The file in the ZIP archive is in
Japanese. (AI should be able to read Japanese as well.)
---
name: jaxa-earth-api
description: Using JAXA Earth API for JavaScript, you can retrieve Earth observation data such as terrain (elevation, DSM), land surface temperature (LST), sea surface temperature (SST), vegetation index (NDVI), precipitation, chlorophyll-a concentration (CHLA), and soil moisture content (SMC) as images or numerical values. You can also develop web applications (HTML, JavaScript) that use Earth observation data.
---
# Agent Skills by JAXA Earth API for JavaScript
## Overview
Using this skill, you can retrieve Earth observation data as images or numerical values.
The available data includes terrain (elevation, DSM), land surface temperature (LST), sea surface temperature (SST), vegetation index (NDVI), precipitation, chlorophyll-a concentration (CHLA), and soil moisture content (SMC).
Perform the following processing as needed.
- Read the dataset catalog and select the necessary dataset.
- Run the command-line tools in scripts in a simple manner by specifying arguments such as the dataset name and longitude/latitude, and retrieve statistics as STDIO output strings or save them as PNG images.
- If the existing command-line tools do not provide enough functionality, understand the API documentation and create and run a new command-line tool, referring to the command-line tools in scripts and the examples in assets.
- If you want to represent and use the data in a more advanced way in the browser, create a web application in HTML.
- When presenting the retrieved data, clearly indicate which dataset was used and how the result was retrieved and processed. Also present the link to the detailed information obtained with `getLinks.js`.
- For the knowledge needed to explain the retrieved data, search publicly available information and explain it using expertise in Earth science, meteorology, and aerospace engineering.
~~~~~~~~~~(partially omitted)~~~~~~~~~~
## How to select a dataset
Read the dataset catalog and search for the dataset needed for your answer. We recommend selecting in the following priorities.
1. Preferentially select from those listed under Main Recommended Data in the dataset catalog.
2. If you want to understand seasonal changes, select monthly data (temporalResolution: monthly), which provides data with fewer missing values and makes the spatial distribution easier to grasp. If you want to investigate at as fine a time unit as possible, select daily data (temporalResolution: daily). Note, however, that some pixels may be missing, such as those outside the observation range or under clouds.
3. There may be datasets of the same physical quantity with different spatial resolutions (spatialResolution). Choose the best one possible (the one with the smaller number in km).
4. Also pay attention to whether the data is observed values (normal: false) or climatological normals (normal: true). Climatological normals are used as a reference when calculating the difference from the normal.
If multiple candidates are found, present the advantages and disadvantages of each and ask the user to choose.
Also, when outputting the final result, clearly indicate which dataset was used, along with the reason.
## How to use CLI tools
The following command-line tools are available for simple execution.
Move the saved files to the current working directory so that they are easy for the user to find, or run the command-line tool by specifying it with a relative path from the working directory.
If an error occurs, recheck whether the combination of collectionUrl and band exactly matches the information in the dataset catalog, and whether the specified date is within the dataset's availability period.
Also, an SSL error may occur depending on the network conditions of the terminal running this skill.
In that case, add `process.env["NODE_TLS_REJECT_UNAUTHORIZED"] = "0";` at the beginning of the command-line tool to avoid the SSL error.
### `getImage.js`
This is a command-line tool that can retrieve data for a specified longitude/latitude range as a PNG image.
~~~~~~~~~~(partially omitted)~~~~~~~~~~
## How to calculate statistics
To calculate statistics for a retrieved dataObject, use `je.data.stat` or `je.data.globalStat`.
`je.data.stat` does not account for the difference in area per pixel on the actual Earth surface.
This simple calculation is fine when the longitude/latitude range is narrow enough that the difference in area per pixel can be ignored, but to perform a rigorous evaluation on data over a wide longitude/latitude range where the area per pixel differs, use `je.data.globalStat`.
Also, if you want to retrieve statistics by prefecture, you can calculate them by masking with GeoJSON, referring to the source code in `assets/example/65_mask/`.
The GeoJSON for each prefecture is stored in `assets/geojson/`.
## How to search a location with specific value
Instead of specifying a longitude/latitude to retrieve a value, when you want to reverse-search for a location with a specific condition such as the maximum location or the minimum location, use `getLngLatValuesCsv.js`.
1. Use `getLngLatValuesCsv.js` to first retrieve data over a wide area and narrow down candidate locations from it.
2. Then run `getLngLatValuesCsv.js` on a narrow range around those candidate locations to identify the location with high precision.
3. Once the location is identified, explain the significance of that location and the reason it has such a value, using expert knowledge.
## How to search a date with specific value
Instead of specifying a date and time to retrieve a value, when you want to reverse-search for a date and time with a specific condition such as the maximum period or the minimum period, use `getMonthlyTimeSeriesValues.js` or `getDailyTimeSeriesValues.js`.
1. Use `getMonthlyTimeSeriesValues.js` to first retrieve data on a yearly basis and narrow down candidate periods from it. We recommend using a Monthly dataset.
2. For those candidate periods, use `getDailyTimeSeriesValues.js` to narrow down the dates matching the condition. We recommend using a Daily or Half-monthly dataset.
3. Once the date is identified, explain the reason taking into account the season of that date and time, using expert knowledge.
## How to create web applications
Referring to the sample code in `assets/example/`, understand the API documentation and create the HTML in the current working directory.
Note that, unlike the sample code, `jaxa.earth.esm.js` can be retrieved directly from online by writing `import * as je from "https://data.earth.jaxa.jp/api/javascript/v2.0.1/jaxa.earth.esm.js";`, so there is no need to make a copy.
## How to select colors
When creating a new command-line tool or web application, we recommend the following settings for `je.image.ColorMapObject` when outputting images.
### colors
For `je.image.ColorMapObject#colors`, the recommendations are as follows.
- **je.Colors.GRAY**: Colors from black to white. Use this only when the user requests a black-and-white image.
- **je.Colors.JET**: Colors from blue to light blue to green to yellow to red (rainbow). Use this preferentially when none of the below apply.
- **je.Colors.NDVI**: Colors from brown to green. Suitable for visualizing the vegetation index. The smaller the value, the fewer (more withered) the plants; the larger the value, the greener and more abundant the plants.
- **je.Colors.SMC**: Colors from red to white to blue. Suitable for visualizing soil moisture content. The smaller the value, the redder and drier; the larger the value, the more moist.
- **je.Colors.IC**: Colors from navy to white. Suitable for visualizing sea ice concentration. The smaller the value, the less ice; the larger the value, the more ice.
In addition to the above, you can also specify an array of arbitrary color code strings. We recommend proposing the color combination needed for effective data visualization.
For example, when the value range is around zero, such as -10 to +10, and you want negatives in blue, the central 0 in white, and positives in red, specify it as `colors: ["0000ff", "ffffff", "ff0000"]`.
### min, max
For the value range `je.image.ColorMapObject#min` and `je.image.ColorMapObject#max`, when outputting only a single image you can dynamically match them to the `min` and `max` obtained from `je.data.stat(dataObject)`, but when animating a time series, it is not appropriate for the value range to change from image to image.
In such cases, we recommend specifying the following values for the main datasets.
- **Terrain (elevation, DSM)**: 0 to 6000 m for global scale, 0 to 4000 m for the Japan region.
- **Land surface temperature (LST)**: -50 to 50°C for global scale, -20 to 50°C for the Japan region. If the dataset is in Kelvin, add 273.15 to each.
- **Sea surface temperature (SST)**: 0 to 40°C. If the dataset is in Kelvin, add 273.15 to each.
- **Vegetation index (NDVI)**: 0 to 1
- **Precipitation**: 0 to 10 mm/hr. Specify `je.image.ColorMapObject#log: true` to use a logarithmic scale.
- **Chlorophyll-a concentration (CHLA)**: 0 to 100 mg/m^3. Specify `je.image.ColorMapObject#log: true` to use a logarithmic scale.
- **Soil moisture content (SMC)**: 0 to 30%.
- **Sea ice concentration (IC)**: 0 to 100%.
Even for the same physical quantity, the values can differ greatly if the units differ.
In particular, temperature-related datasets come in both Celsius and Kelvin units, so be careful not to specify the wrong value range depending on the unit.
After deciding on a dataset, you can confirm its unit by running `getValue.js`.
Also, when displaying land surface temperature and sea surface temperature simultaneously, it is effective to align the value ranges of both.
## How to select bbox, width, height
For the `bbox`, `width`, and `height` specified for `je.getDataObject`, be careful not to distort the aspect ratio.
We recommend deciding `bbox` according to the region of interest, fixing `width` to around `width=1000` based on the screen size, and calculating and using a `height` that does not distort the aspect ratio.
~~~~~~~~~~(remainder omitted)~~~~~~~~~~
How to Run
Installing Gemini CLI
Following the official information for Gemini CLI, install Gemini CLI and authenticate your Google account. Using the latest Node.js, you can install it with the following command.
npm install -g @google/gemini-cli
Launch it with the following command.
gemini
Authenticate your Google account when prompted.
Installing Agent Skills
Create a .gemini/skills/ folder in the folder where you run Gemini CLI, and save the
complete set of files in the aforementioned jaxa-earth-api/ there.
- (Files being worked on and output files produced by Gemini CLI, etc.)
- .gemini/
- skills/
- jaxa-earth-api/ //Save this entire folder
- SKILL.md
- package.json
- scripts/
- references/
- assets/
If Gemini CLI is running, press [Ctrl] + C twice to exit, then launch it again.
Try asking the launched Gemini CLI, "What can the jaxa-earth-api skill do?" After approving the execution of the Agent Skills, the installation is complete if it can answer with its functions as shown below.
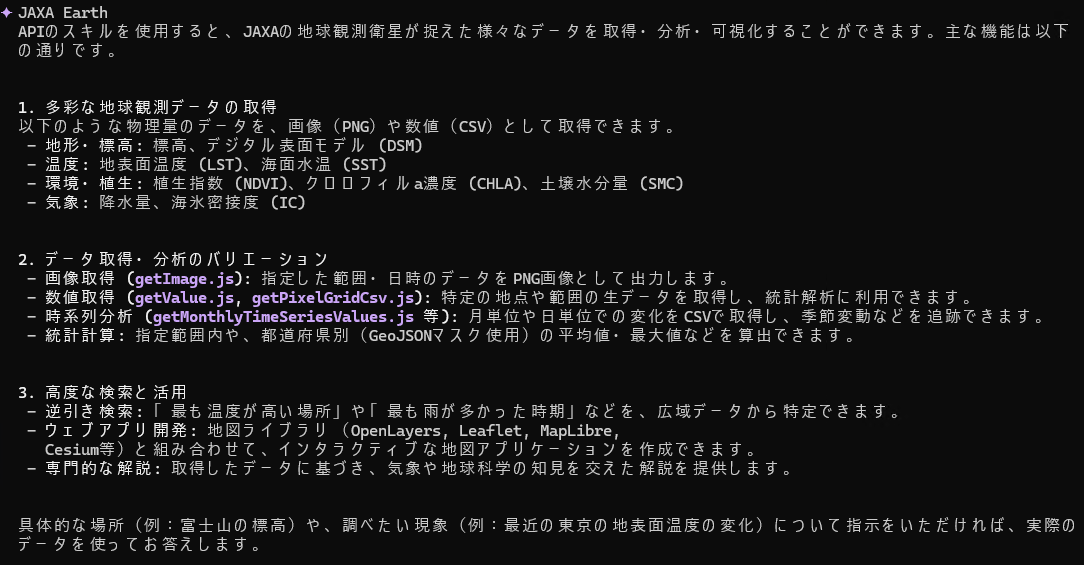
Examples
By making full use of the Agent Skills functions, the generative AI can select the necessary dataset, retrieve values and images, and provide guidance to detailed pages. It is also possible to generate a web page that displays data.
In addition, based on the built-in sample code and API documentation, Gemini CLI can automatically create and run source code for data processing as needed and output the results. For the created source code and functions, you can also update this Agent Skills by instructing it to "reflect this as a function of the skill."
Note that this page is intended to introduce a demonstration in which the generative AI autonomously
handles Earth observation data.
Please note that the output of the generative AI shown below is presented as it was originally
output, and its scientific accuracy has not been verified.
Also, depending on the type and version of the generative AI used and the content of past
conversations, the same question may produce differences in how the tools are used and the
parameters entered, leading to different results.
Example of Creating an Image and a Web App
Since scripts/ does not include a built-in function to save an image that composites two
types of datasets, source code to save the composited PNG image is automatically created and run.
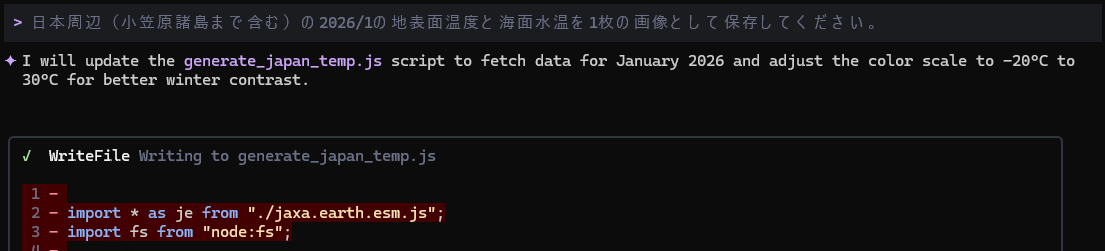
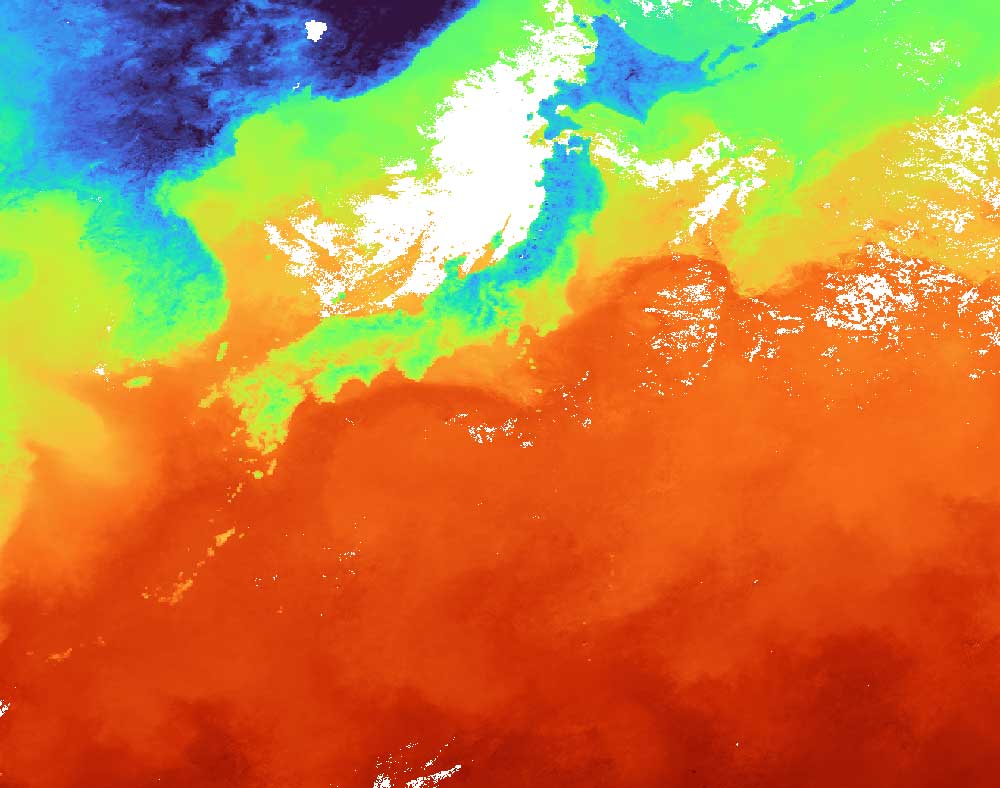
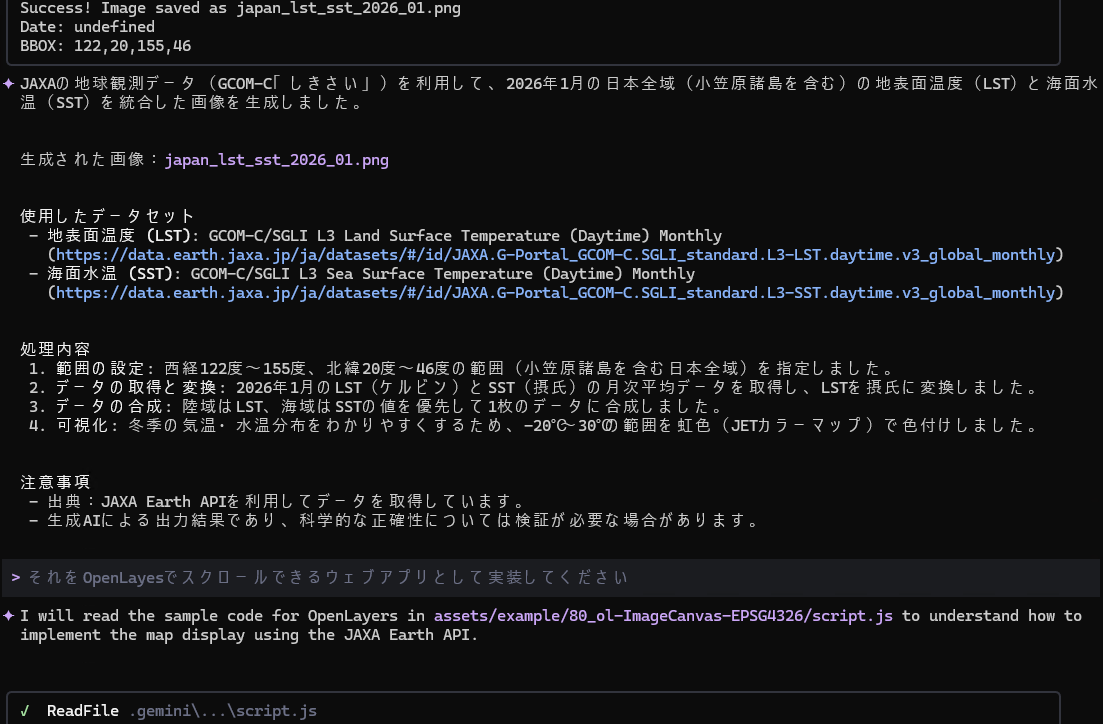
As stated in SKILL.md, it aligned the colors of land surface temperature and sea surface
temperature. It also generates HTML to display an image of the same conditions in the browser.
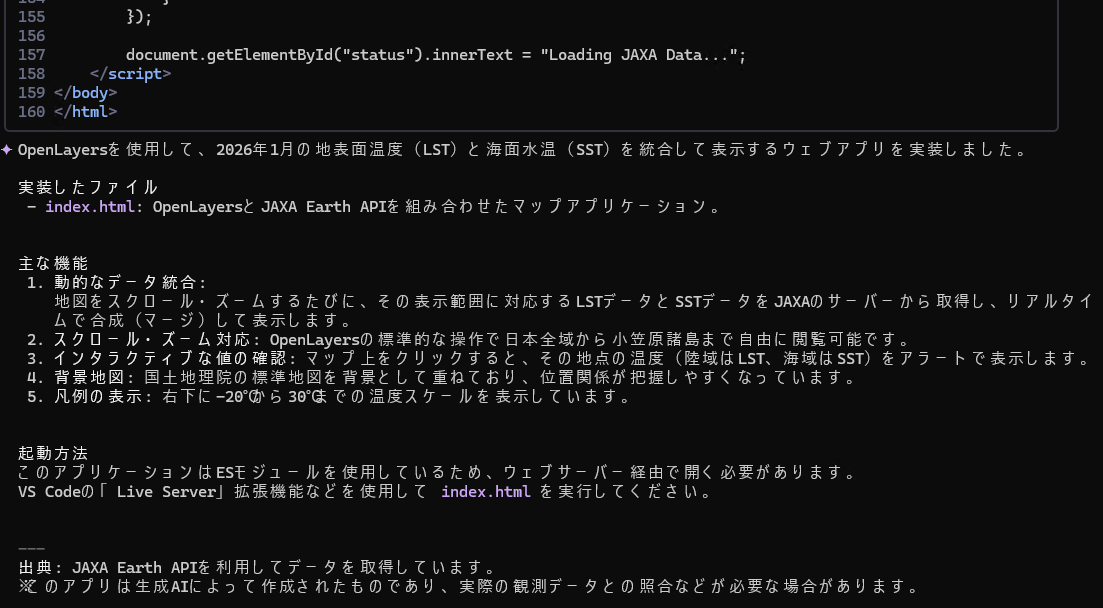
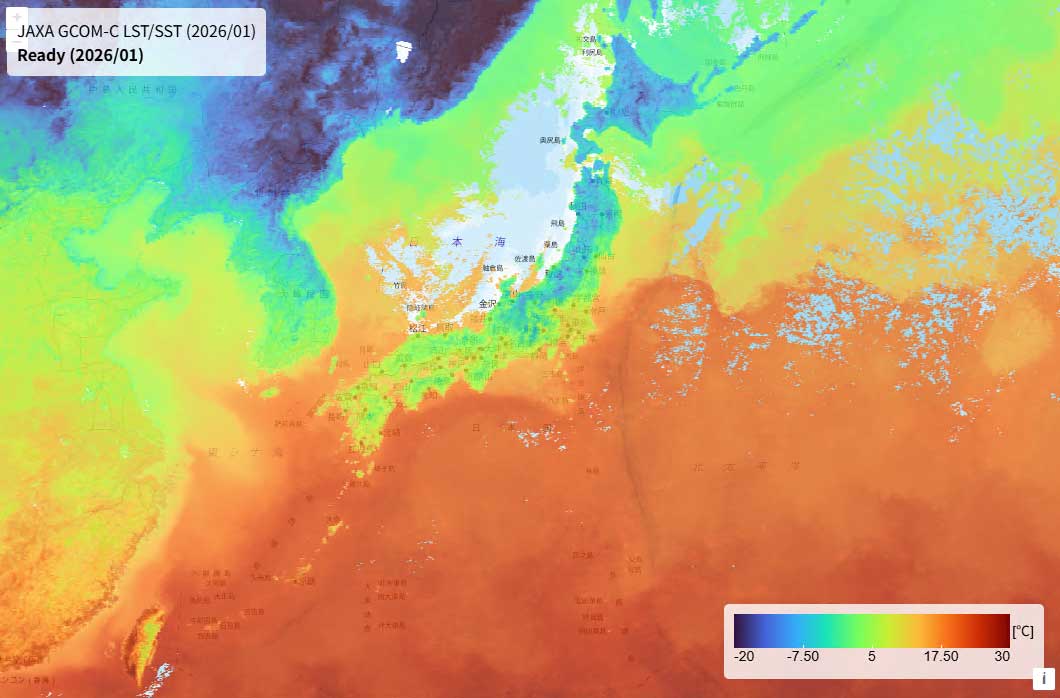
Unlike a PNG image, a page that can be freely scrolled on the browser's map was created.
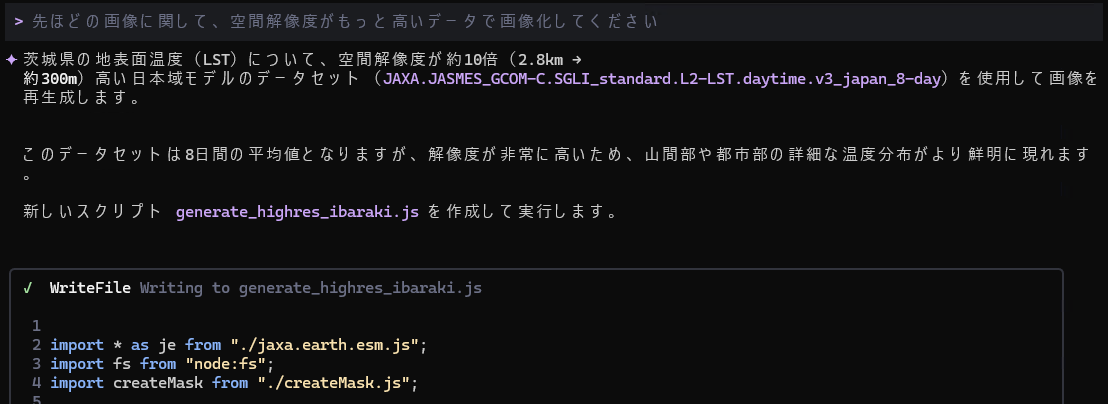
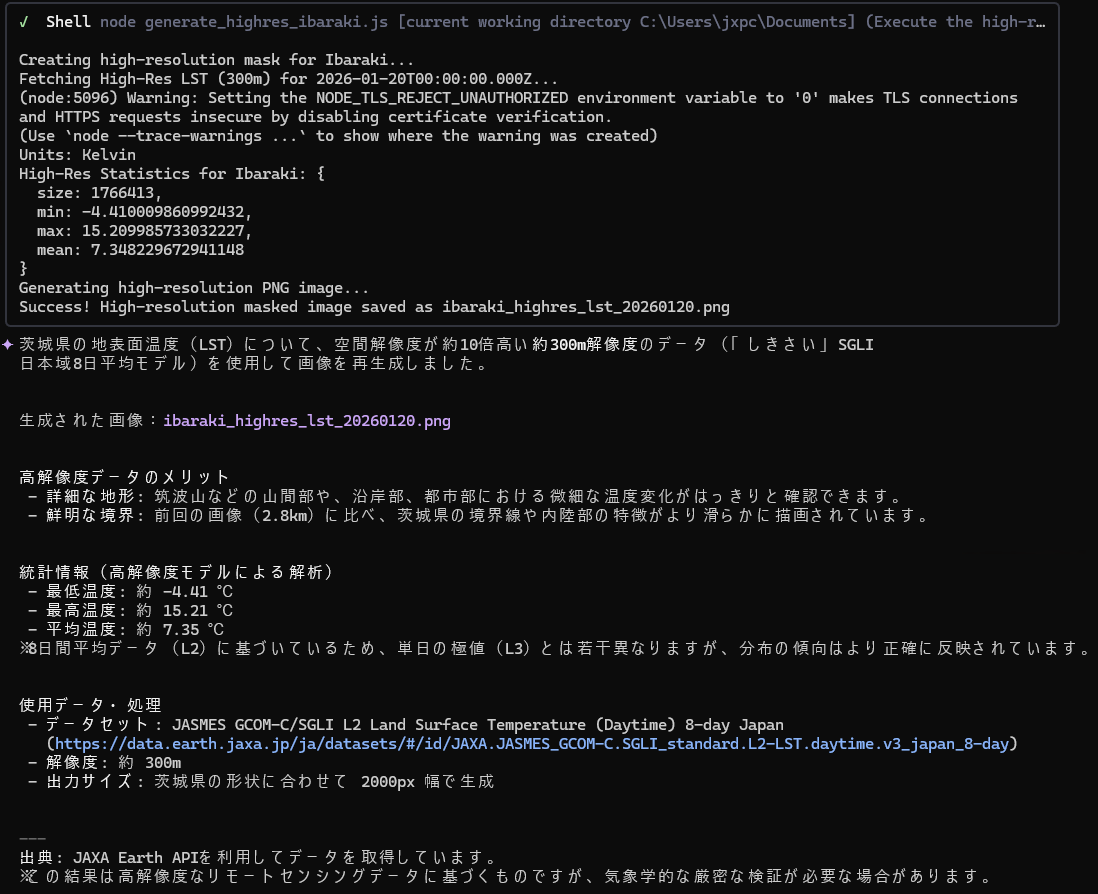
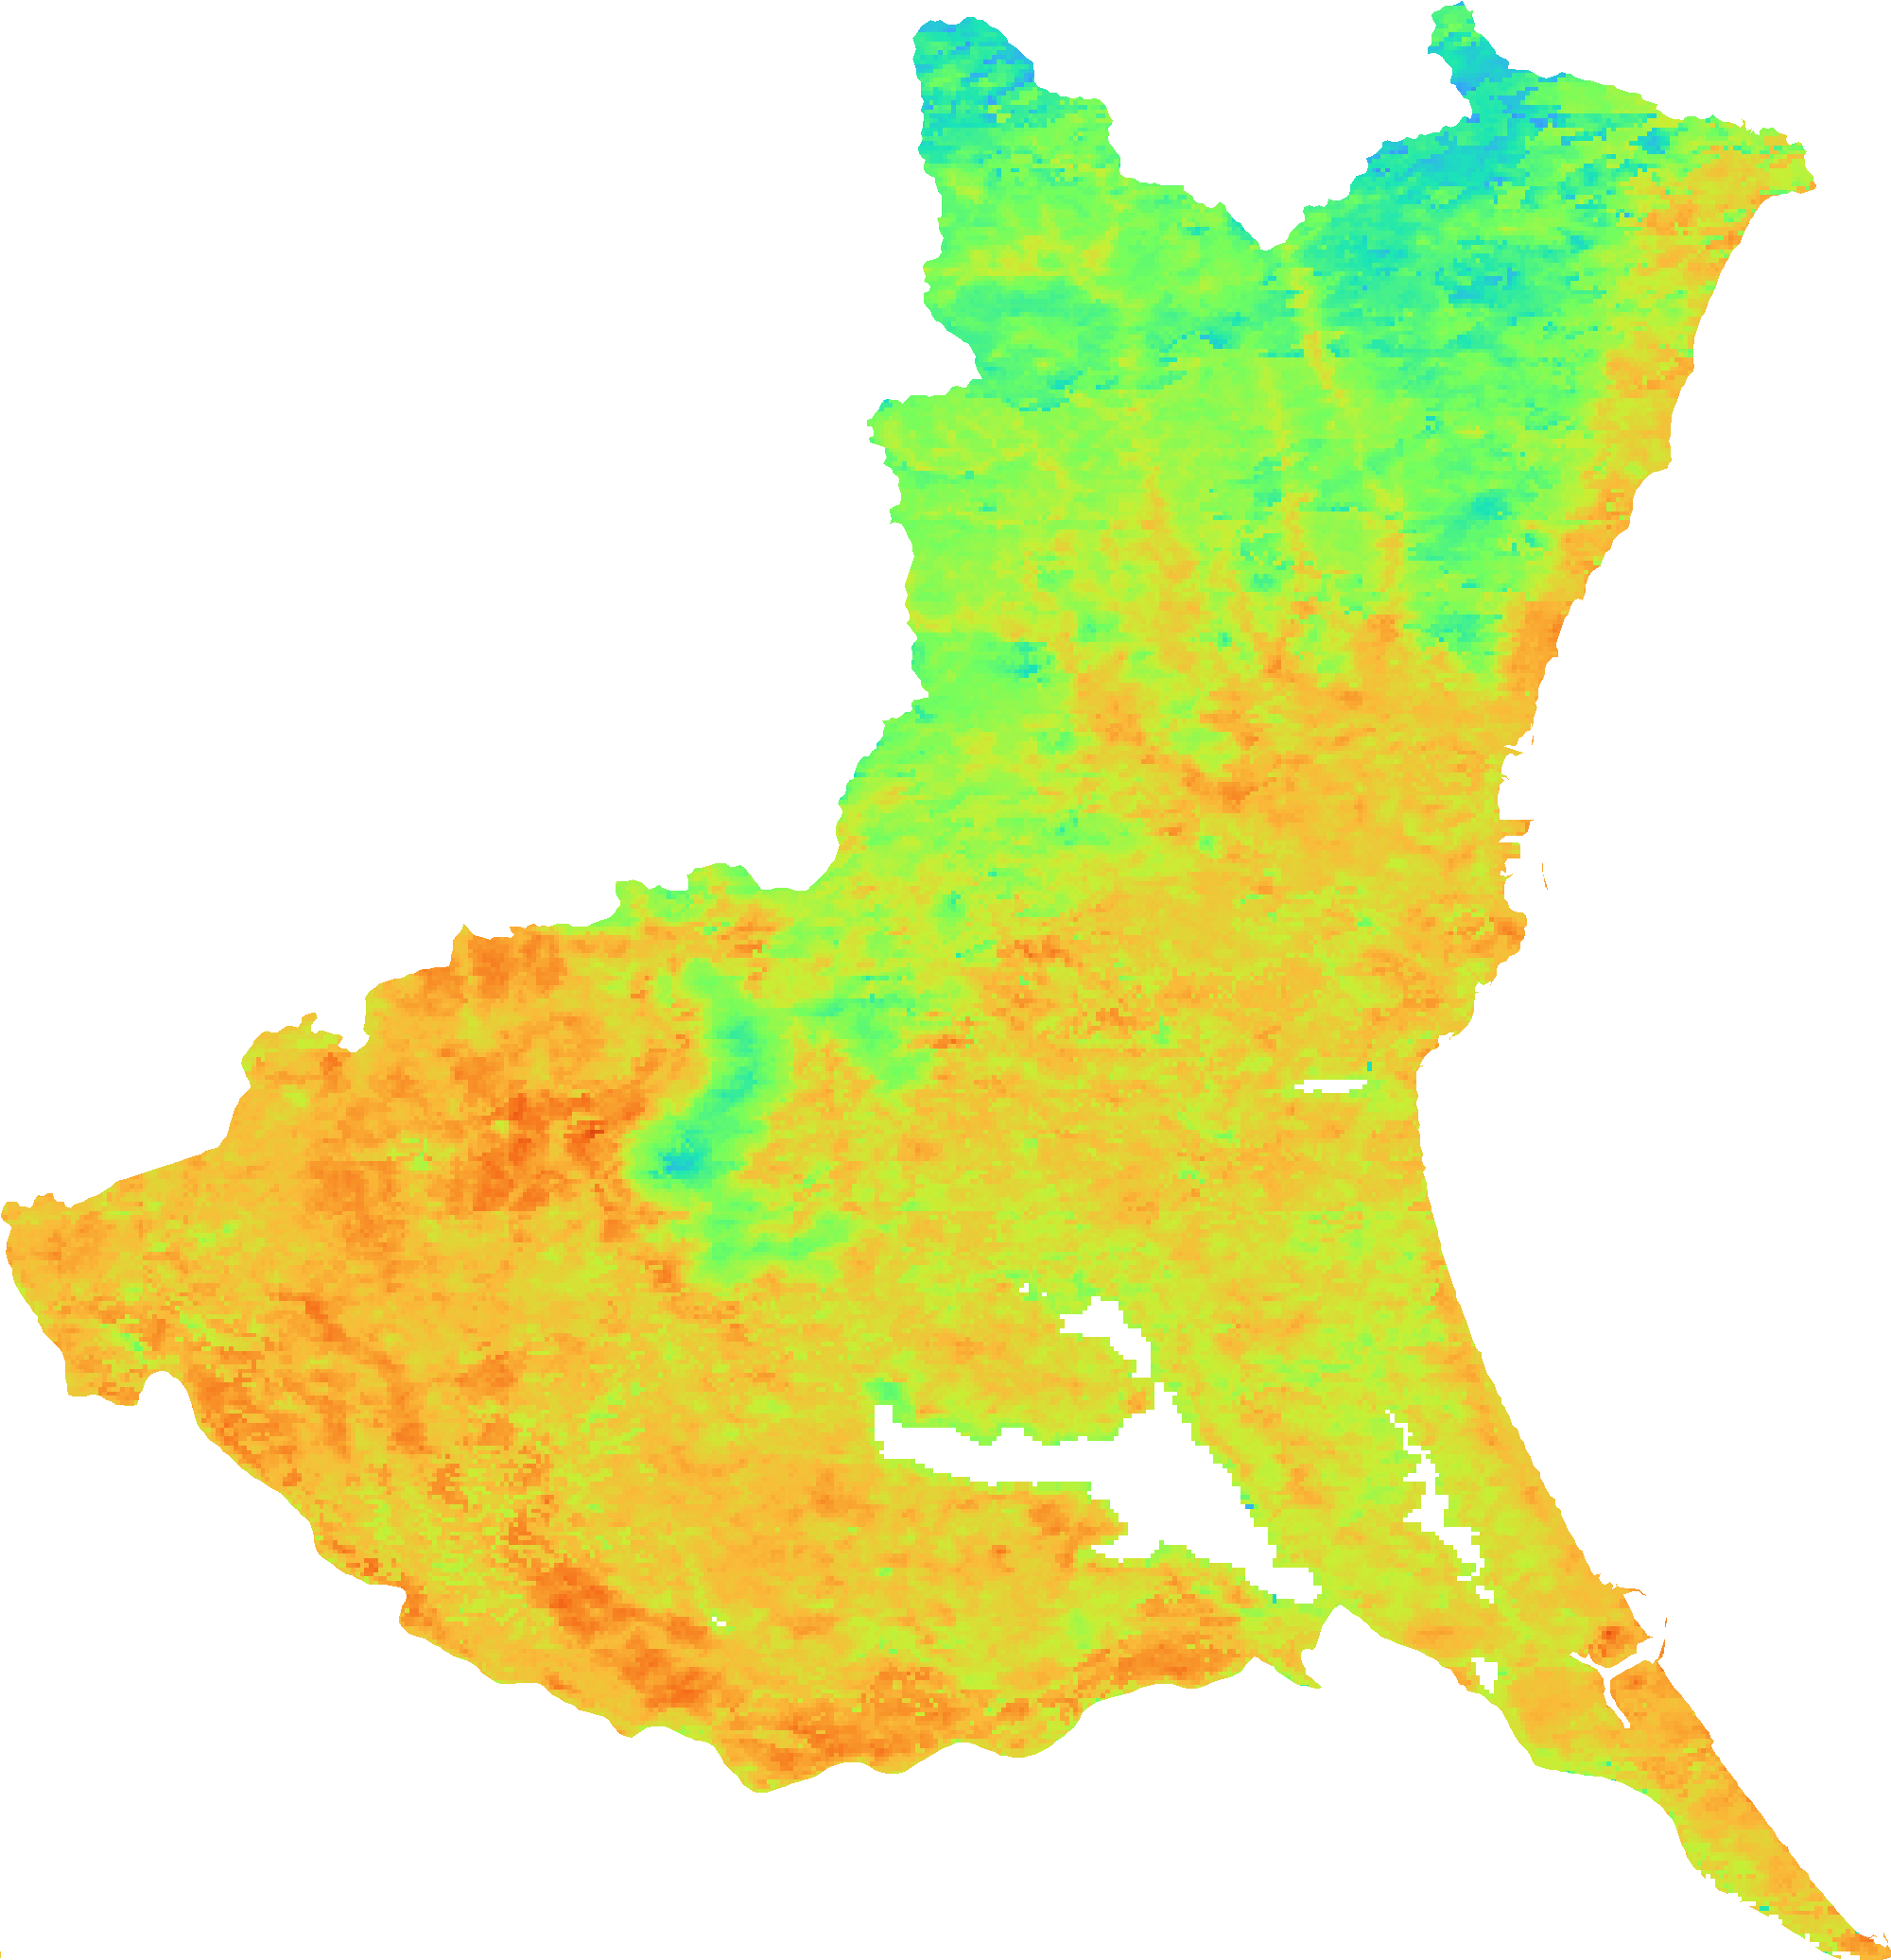
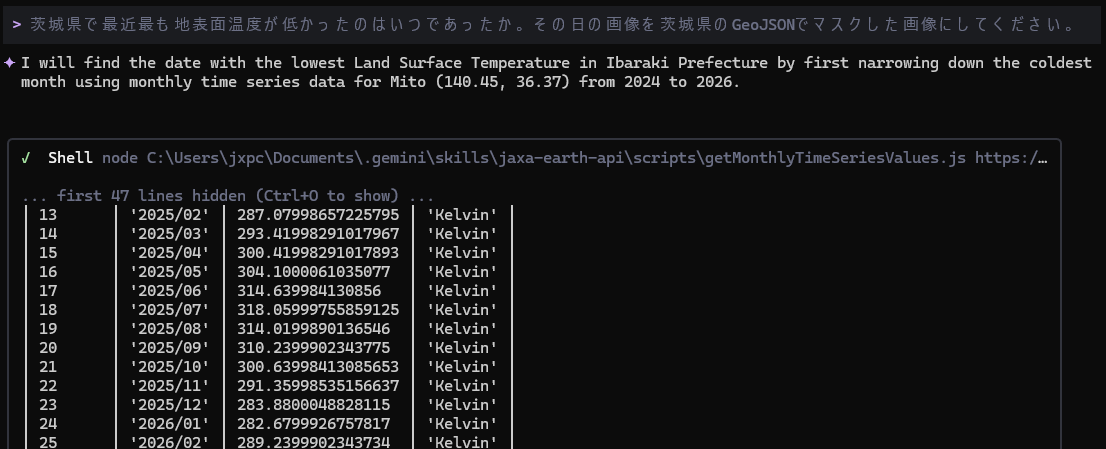
Finding a Date with a Specific Condition and Turning It into an Image
By repeatedly using the function that retrieves time-series data, it identifies, for example, the day when the land surface temperature was lowest. The source code for masking with prefecture GeoJSON is automatically created and run, referring to the sample code built into the Agent Skills.
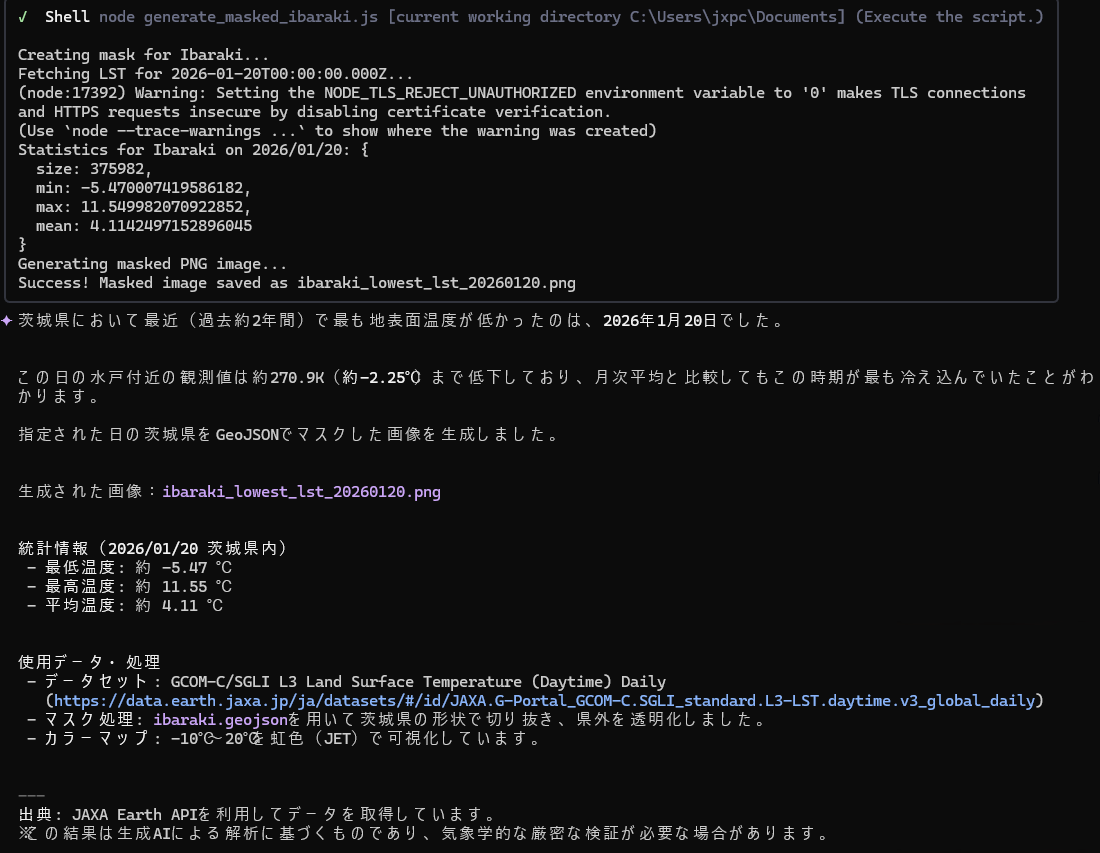
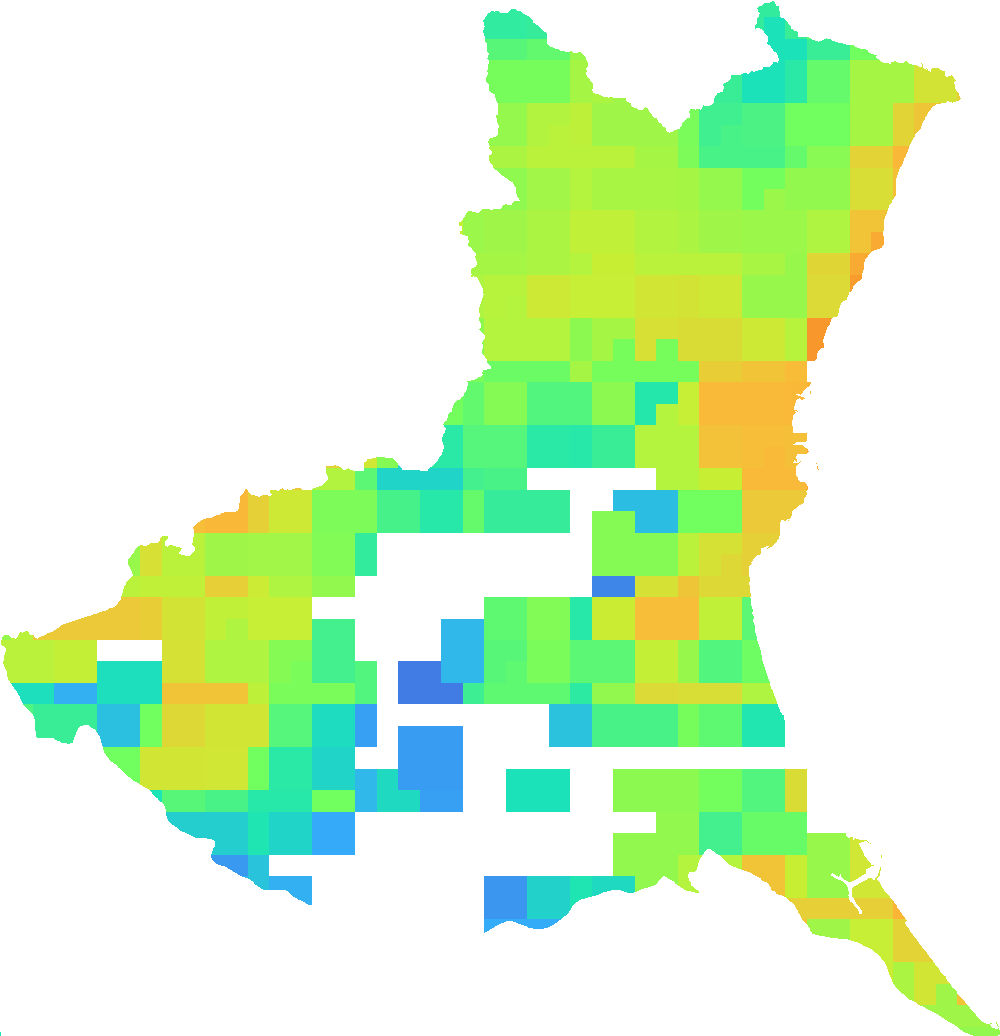
If the image resolution is low, you can also have it reselect a higher-resolution one and run again.