JAXA Earth API for JavaScript
This is the API documentation for JAXA Earth API for JavaScript Version 2.0.1. Using this API, you can easily display Earth observation data in the browser, and develop web applications that make use of Earth observation data. A key feature of this API is that it is designed to handle data within the required scope and resolution. This makes it possible to work with the data even when using JavaScript in a browser.
Starting from the Version 2 series, in addition to the browser's main thread, it now also supports execution in browser web workers, Node.js, Deno, and Bun. Development with TypeScript is now also possible. As a result, the specifications have changed significantly compared to the Version 1 series.
Quick Start
What can you do?
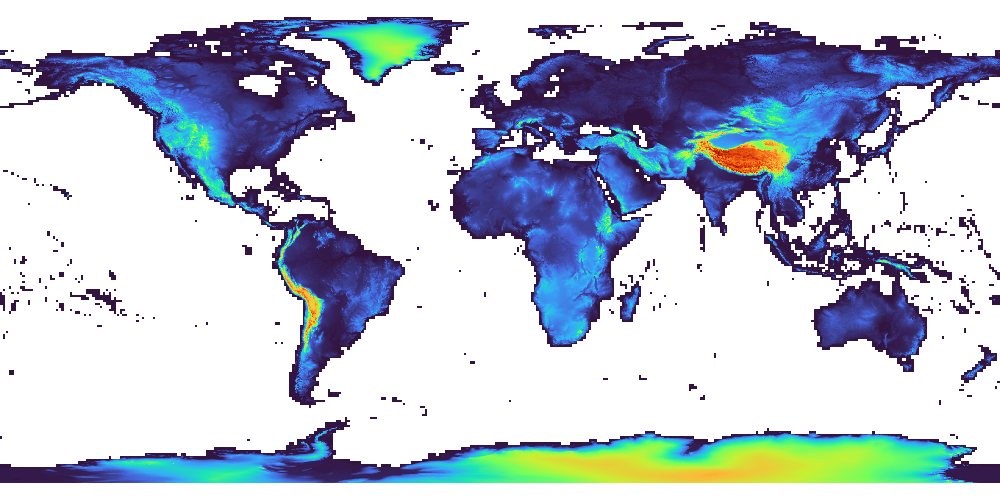
You can access Earth observation data with just a few lines of programming. No user registration or API key is required.
// Retrieve the global terrain data (JAXA AW3D) as an image of width 1000px and height 500px
const dataObject = await je.getDataObject({
collectionUrl: "https://s3.ap-northeast-1.wasabisys.com/je-pds/cog/v1/JAXA.EORC_ALOS.PRISM_AW3D30.v3.2_global/collection.json",
bbox: [-180, -90, 180, 90], //[West, South, East, North]
width: 1000,
height: 500,
});
// Color elevations from 0m to 6000m with a rainbow gradient of blue, green, yellow, and red
const colorMap = new je.image.ColorMap({ min: 0, max: 6000, colors: je.Colors.JET });
// Append the visualized result to the HTML as an HTMLCanvasElement
document.body.appendChild(je.image.createCanvas(dataObject, colorMap));
Run the sample code
Go to the sample code page here
Run on CodePen
Press "Run Pen" on the Result tab to run it. If you open "EDIT ON CODEPEN" in the upper right, you can also edit the source code directly and try it out.
See the Pen The simplest example by JAXA Earth API (@jaxa-earth) on CodePen.
Let's build some sample code
Other notes
-
About the data structure and concepts, and an overview of each class
-
API documentation including details of each module and class
Tutorial
Let's try some concrete development. You can overlay data on a map, create 3D models, display graphs, and more. For various other sample code, click here.
Analysis processing
- Display a time-series animation and graph
- Check the correlation of data
- Calculate the deviation from the average using pixel-wise operations
- Apply a mask with GeoJSON and calculate statistics
File output
- Save a CSV file
- Create a GLB file of a 3D model
- Create a KMZ file that can be opened in Google Earth
Map API integration
- OpenLayers
- Leaflet
- MapLibre GL JS (3D display)
- CesiumJS (3D display)
- ArcGIS Maps SDK for JavaScript (3D display)
CesiumJS execution example:
See the Pen CesiumJS example by JAXA Earth API (@jaxa-earth) on CodePen.
Generative AI integration (MCP)
You can also build an MCP for integrating with generative AI. This makes it possible for generative AI to handle Earth observation data. The MCP can be used not only with the generative AI used in the samples below, but also with various other generative AIs. In addition, using other MCPs, such as one for file saving, enables the generative AI to organize and write out the results as a CSV file.
- MCP basics (STDIO edition)
- MCP basics (Streamable HTTP edition)
- MCP basics (MCP Apps edition)
- MCP practical edition (data retrieval and web app development)
Generative AI integration (Agent Skills)
Generative AI integration via Agent Skills is also possible. By using it in combination with a generative AI that can create and run source code, the generative AI can, based on the built-in sample code and API documentation, automatically create and run data-processing source code as needed and output the results.
For developers
Downloading the module
The module required for execution, and the type definition files useful for TypeScript development, are as follows. The module file is only 120KB, and there are no other dependency modules that need to be installed.
ESM format
- https://data.earth.jaxa.jp/api/javascript/v2.0.1/jaxa.earth.esm.js
- https://data.earth.jaxa.jp/api/javascript/v2.0.1/jaxa.earth.esm.d.ts
UMD format
- https://data.earth.jaxa.jp/api/javascript/v2.0.1/jaxa.earth.umd.js
- https://data.earth.jaxa.jp/api/javascript/v2.0.1/jaxa.earth.umd.d.ts
AI-driven development
As information for developers who use generative AI, documents in Markdown format are available below. By attaching these files to a generative AI, it becomes possible to some extent to create source code and select datasets. However, depending on the type of generative AI used and the context of the questions, you may not always get the expected results.
API documentation
List of available datasets
Usage examples
Examples of usage with the JAXA Earth API for JavaScript are as follows. Some of them use older versions of the API.
This simulates sea level rise using terrain data and OpenLayers. By switching the color map according to the slider setting, the colors are repainted instantly. (Japanese Version Only)
This simulates sea level rise using terrain data and OpenLayers. In the global version, the shaded relief map shown in the background is also generated dynamically using JavaScript.
You can compare the year-on-year changes in sea surface temperature and see the impact of climate change. With its simple screen layout, it can also be used as educational material for elementary and junior high school students that can be displayed even on tablet devices. (Japanese Version Only)
By using Observable, you can run the JAXA Earth API for JavaScript interactively in the browser.
By using CodePen, you can run the JAXA Earth API for JavaScript interactively in the browser.
This is a website that allows you to browse and use various data using OpenLayers. It is currently under development using the JAXA Earth API for JavaScript. (Japanese Version Only)
Using the JAXA Earth API for JavaScript, the latest observation data of sea surface temperature around Japan is displayed continuously. (Japanese Version Only)
License
The JAXA Earth API can be used commercially, except when using some datasets. For details, please check this page.
THIRD PARTY LICENSE(s)
- pako, MIT license (used for deflate compression/decompression in the Bun runtime, which does not support the Compression Streams API)
Release notes
- 2026/05/22 - Released Version 2.0.1 (this document). Fixed the processing for RGB color images and added support for hourly datasets.
- 2026/03/09 - Added the Agent Skills tutorial.
- 2026/03/04 - Added a sample using GeoJSON.
- 2026/02/25 - Added a sample using CesiumJS and a CodePen.
- 2026/02/18 - Released Version 2.0.0 (Japanese Version Only).
- 2025/02/27 - Released Version 1.2.3.