Overview
The JAXA Earth API provides access to a variety of datasets observed by Earth observation satellites. These include datasets such as topography, land surface temperature, and sea surface temperature. For details on the available datasets, please refer to this page.
The JAXA Earth API also provides datasets in which monthly statistics and similar values have been precomputed. When the statistics period differs, the data is managed as separate datasets, each with a different ID.
Retrieving Data
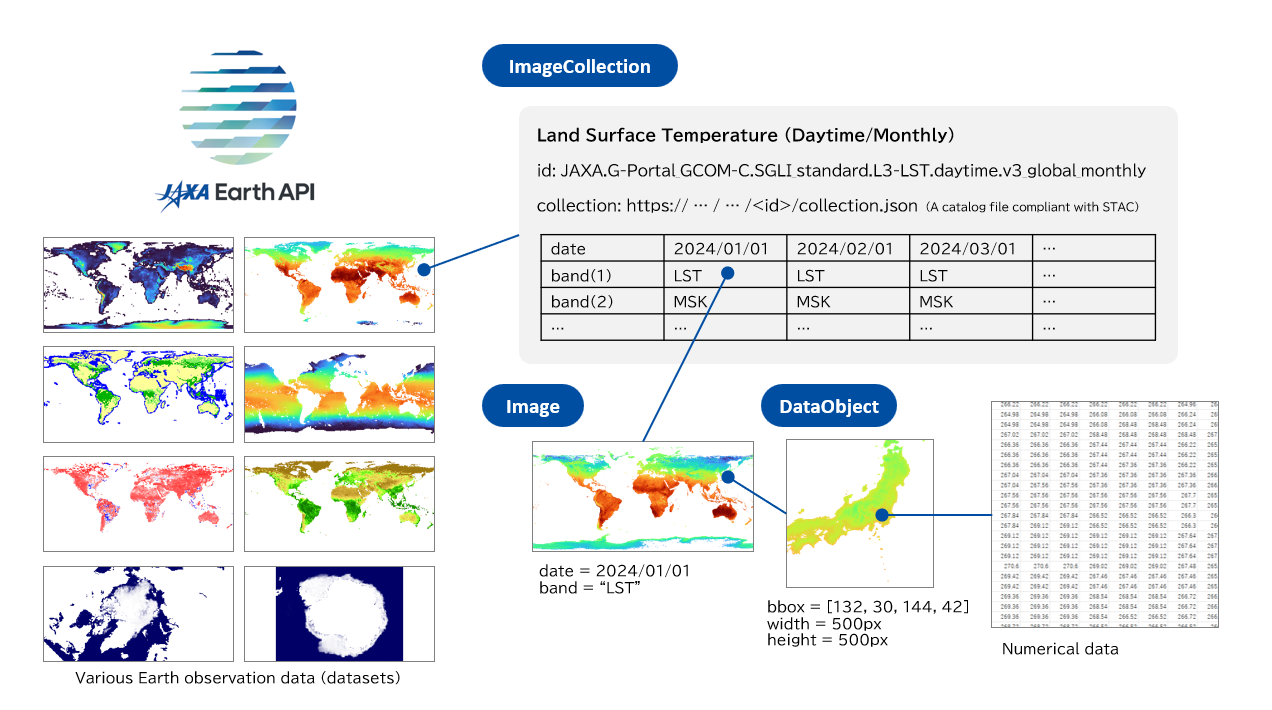
ImageCollection
In JAXA Earth API for JavaScript, the object corresponding to each dataset is called an ImageCollection.
An ImageCollection contains multiple Image objects, each
with a different observation date and time.
The data for each observation date and time may also have multiple values (bands).
By specifying an observation date and time and a band for an ImageCollection, you retrieve an Image.
Image
An Image can be thought
of as a single global dataset for a specific observation date and time and band.
For an Image, by
specifying the latitude-longitude range from which you want to retrieve data and the size of the
output image (number of pixels), you retrieve a DataObject containing data for the required range at
the required resolution.
DataObject
A DataObject can be thought of as a single piece of
data for a specific observation date and time, latitude-longitude range, and image size.
It can be turned into a viewable image (such as an HTMLCanvasElement or a PNG image)
for visualization, or processed to compute statistics.
getDataObject
Using getDataObject, you can also retrieve a DataObject in a simplified way by specifying all the
required conditions at once.
const dataObject = await je.getDataObject({
collectionUrl: "https://s3.ap-northeast-1.wasabisys.com/je-pds/cog/v1/JAXA.EORC_ALOS.PRISM_AW3D30.v3.2_global/collection.json",
bbox: [-180, -90, 180, 90], //[west, south, east, north]
width: 1000,
height: 500,
});
However, this is inefficient because internally it prepares an ImageCollection and an Image every time.
In cases such as the following, you can improve efficiency by handling and reusing the ImageCollection and Image directly.
- When you want to retrieve time-series data while changing the date, reuse the
ImageCollection. - When you want to retrieve data for various locations while changing the latitude-longitude
range, reuse the
Image.
Statistical Processing
A DataObject stores per-pixel data as a numeric array.
You can use the Inspector to retrieve the value or coordinates of a
specific location, use stat to retrieve statistics, use createCsv to create a CSV file, or directly
manipulate the numeric array to perform your own custom processing.
Using compute, you can also perform per-pixel operations,
such as unit conversion or calculating anomalies from the climatological normal by subtracting one
DataObject from another.
Visualization
ColorMap
Use a ColorMap
to specify how colors are applied according to the data values.
const colorMap = new je.image.ColorMap({
min: 0,
max: 6000,
colors: je.Colors.JET,
});
createCanvas
Using both a DataObject and a ColorMap,
create an HTMLCanvasElement with createCanvas.
document.body.appendChild(je.image.createCanvas(dataObject, colorMap));
As shown above, you can display it directly as an image on the browser screen. However, it can only be used on the browser's main thread.
createOffscreenCanvas
If you also want to process data in a browser web worker, use an OffscreenCanvas. With
createOffscreenCanvas, you can create an image as an
OffscreenCanvas on a web worker. An OffscreenCanvas rendered on a web
worker can be transferred to the main thread by converting it to an ImageBitmap,
allowing it to be quickly drawn onto an HTMLCanvasElement in the browser. However, it
can only be used in a browser (on the main thread or a web worker).
createPng
If you want to process data in a server-side JavaScript runtime other than a browser, such as
Node.js, Deno, or Bun, output the image as a PNG image.
Since createPng can convert it to a Uint8Array
of a PNG image,
import fs from "node:fs";
// (omitted)
fs.writeFileSync("image.png", await je.image.createPng(dataObject, colorMap));
you can save it to a file as shown above. In addition, when running on a web server,
import { Buffer } from "node:buffer";
// (omitted)
res.type("png");
res.send(Buffer.from((await je.image.createPng(dataObject, colorMap)).buffer));
you can also return a response as a PNG image from the web server, as shown above.
Integrating with Map APIs
The following map APIs have currently been verified to work, and can be integrated with front-end-only development.
Please refer to this page for sample code examples.
In addition, by running on the web server side using Node.js or similar to build a simple WMS/WMTS server, you can also broadly integrate with other common map APIs that support WMS/WMTS.
ImageGenerator
By using ImageGenerator, you can create images using WMS (Web Map
Service) style parameters.
By running on the web server side using Node.js or similar, you can also build a simple WMS server.
TileGenerator
By using TileGenerator, you can create images using WMTS (Web Map
Tile Service) style parameters.
By running on the web server side using Node.js or similar, you can also build a simple WMTS server.
Supplementary Notes
Concept of Time
In the JAXA Earth API, the time of each dataset is defined in Coordinated Universal Time (UTC). Since
a JavaScript Date is usually generated according to the device's local time,
when specifying a time in JAXA Earth API for JavaScript, you must always specify it in UTC. To
specify a time in UTC, use Date.UTC().
Note also that, for a JavaScript Date, the month must be specified as a value from 0 to
11.
You can also specify the time using the ISO 8601 format.
// To specify 2025/02/03 04:05:06 (UTC) (using Date.UTC())
const date = new Date(Date.UTC(2025, 2 - 1, 3, 4, 5, 6));
// To specify 2025/02/03 04:05:06 (UTC) (using the ISO 8601 format)
const date = new Date("2025-02-03T04:05:06Z");
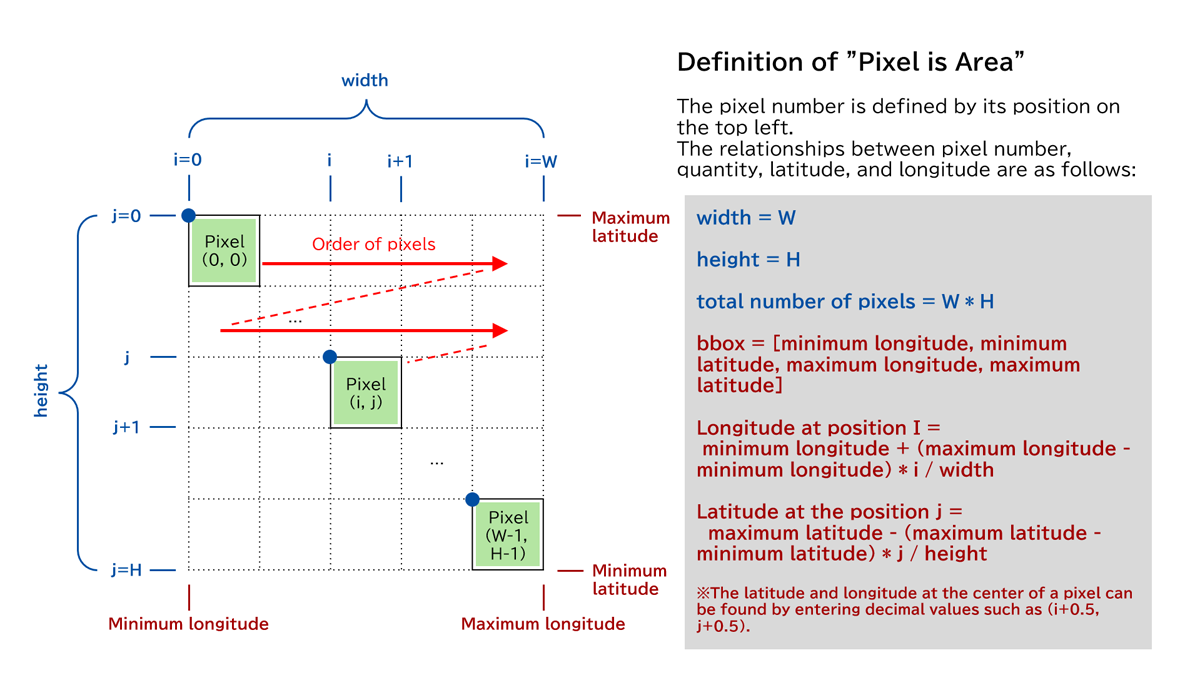
Concept of Pixels and Latitude-Longitude
The JAXA Earth API adopts the "Pixel is Area" convention for defining pixel positions.
The pixel number is defined by the position of the top-left corner of the pixel.
Pixels are arranged in order in the i direction from the top-left to the top-right, and
in the j direction from top to bottom.
In addition, the projection used is equirectangular (EPSG:4326) (except for the Arctic and Antarctic
datasets). As a result, the longitude and latitude in the i and j
directions are evenly spaced.