Access Analysis Tool with Metabase
Overview
In the JAXA Earth Database for API, COG/STAC data are stored in cloud storage. Currently, Wasabi service is used as the main cloud storage service. When a user accesses the database, a text-based access log is generated. We are developing a dashboard viewing tool to analyze the user access of COG and investigate usage trends. The tool consists of Docker for the virtual environment, Python for log analysis, PostgreSQL for the database, and Metabase for the BI (Bussiness Intelligence) tool. By using the tools on this page, users can conduct access analysis of their own databases.
How to use the Access Analysis Tool
Configure environment and convert logs to PostgreSQL database
Install Docker in your environment. Next, download the tool below and unzip.
Next, make and folder to save logs. By default, “C:/wasabi_log” is written as volumes in docker-compose.yml. change your current directry to the location of the Dockerfile. Then, command it.:
$ docker-compose up -d --build
Activate python remote container by using development enviroment such as VS code remote explorer. Set your ID and Secret in set_secret.py. Execute Python Script (main.py) in the container to get logs. By preparing up to this point, WASABI logs are registered in PostgreSQL.
Note
Logs obtained from Wasabi are deleted from the cloud and stored locally, so be careful when handling raw logs.
Metabase configuration and dashboard creation
Access the following address with a browser and start Metabase.
localhost:443
Enter your country, email, name, etc. Then, select PostgreSQL as the database and enter the following information.
Host: db
Port: 5432
Database name: postgres
Username: postgres
Password: metabase
Now you can access postgreSQL from metabase. The database will be updated as necessary by “Synchronize with database schema now” and “Rescan field values now” in Administration -> Database. The following tables can be found stored in the database.
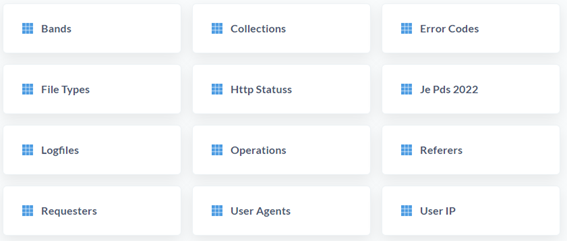
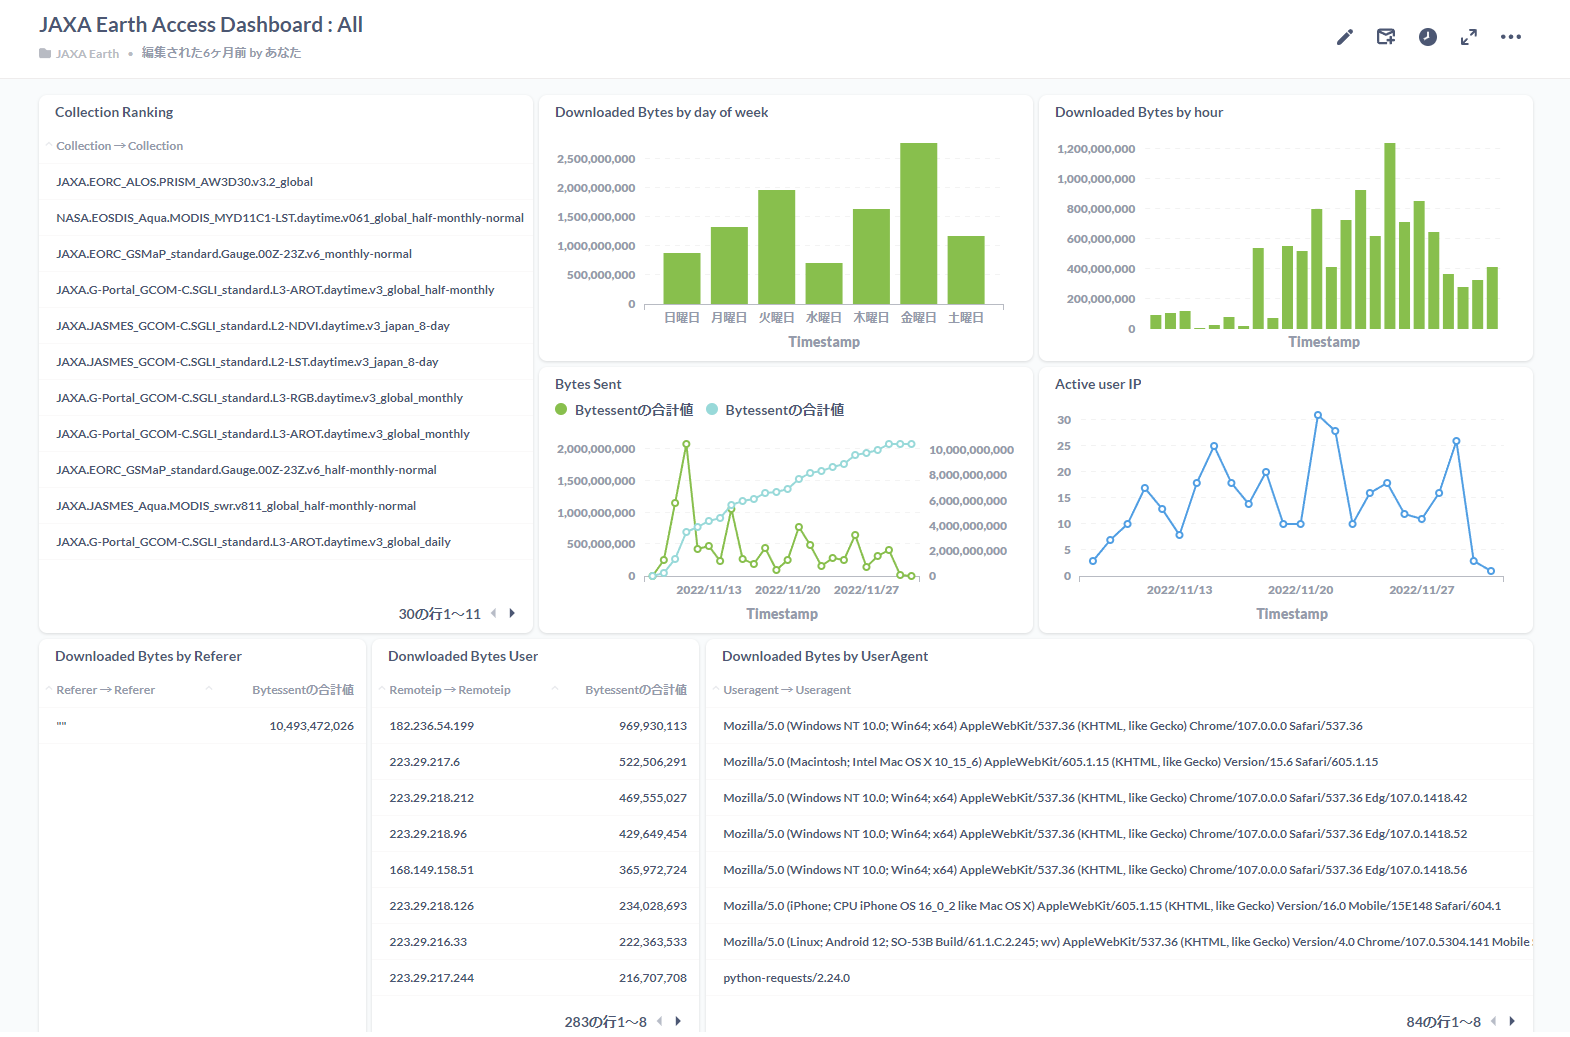
The data is mainly stored in “Je Pds 20XX”. For details on how to use Metabase, please refer to the official manuals and create the dashboard of your choice. The following figure is an example of a dashboard that organizes download volume rankings and time-series data for the COG collection.
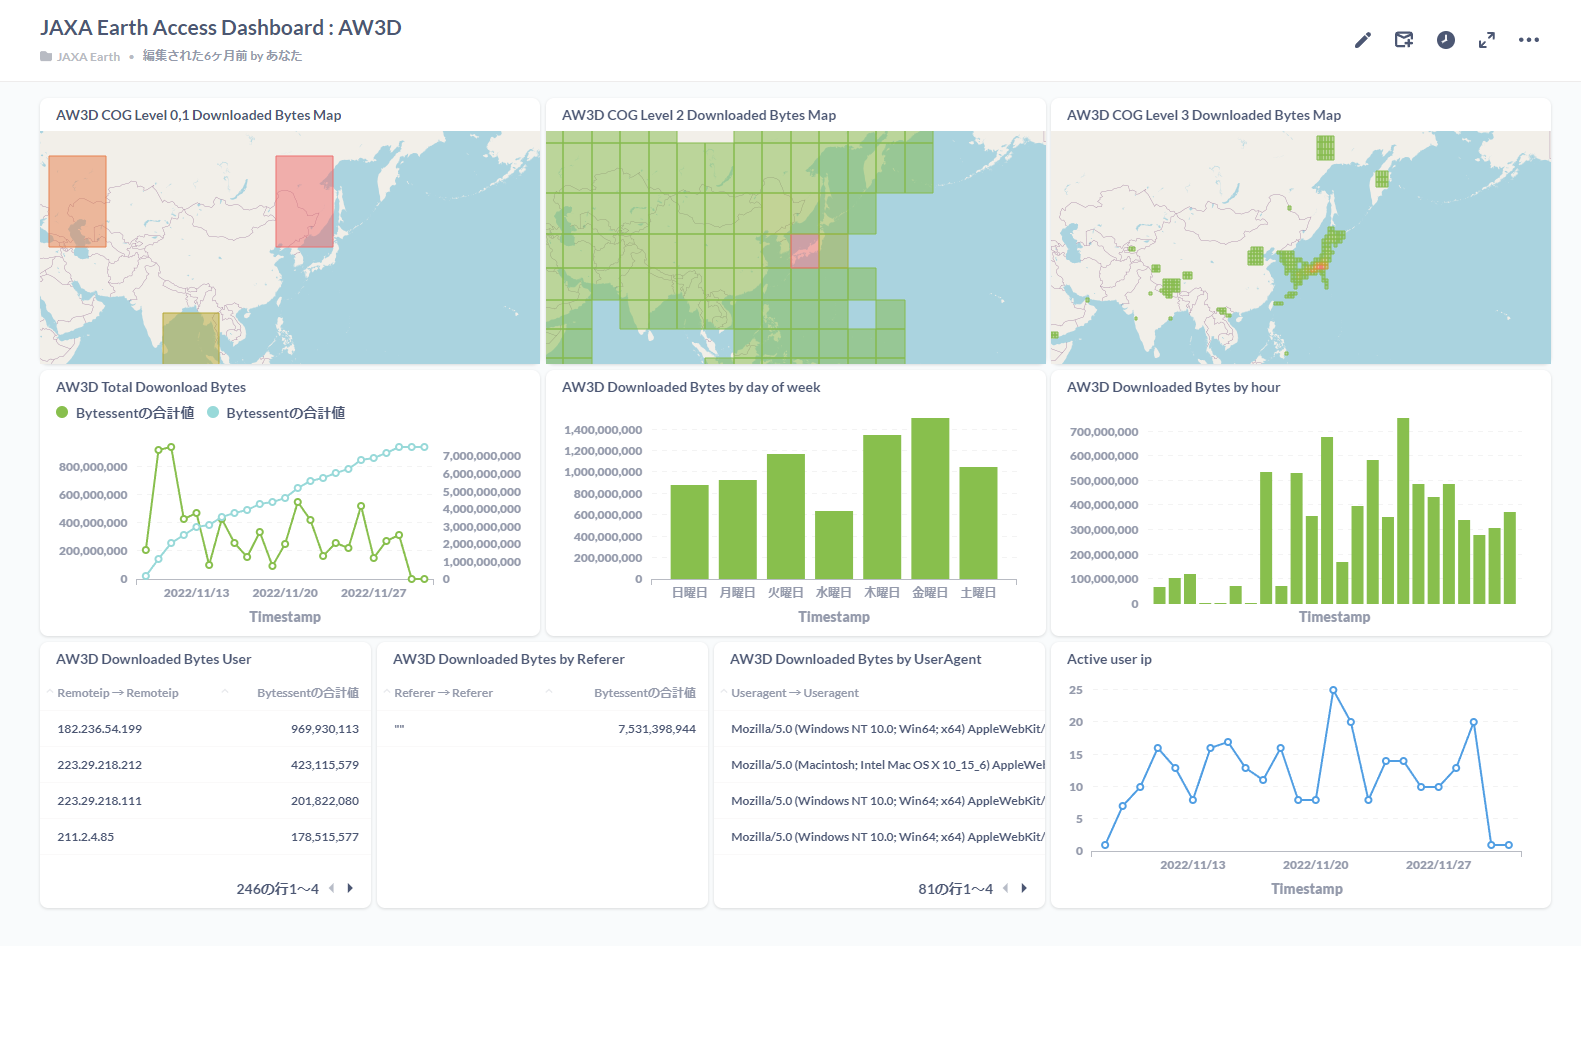
The following figure shows a dashboard that focuses on a single COG collection and visualizes which areas of data are in high demand according to COG level.